2 Data
2.1 Description
The dataset that we will use to to investigate the latest criminal trend for more effective allocation of public safety resources is the NYPD Complaint Data Historic dataset that can be found on the NYC Open Data site. This dataset contains a record of every criminal complaint reported to the New York City Police Department (NYPD) from 2006 to 2023. For our analysis on the most recent trend, we will only be using the records from 2019 to 2023. This dataset was manually queried quarterly from the NYPD system of record, and it reflects all reported complaints available at the time of extraction. The extracted data is then reviewed by the Office of Management Analysis and Planning, and it gets published and updated to the NYC Open Data site annually. Each observation is a criminal complaint that was filed in NYC. From 2019 to 2023, there are 2,395,849 observations with 35 columns documenting relevant information, including but not limited to the exact date, time, location, offense type, level of offense, and details of the suspect and victim of a complaint. There are no major issues with this dataset, except that according to the footnote, when information was not available or unknown at the time of the complaint report, the fields would be entered as “Unknown/Not Available/Not Reported” or simply, just left as null, and when read into R, null would be interpreted as “(null),” so there are conversions our team needs to do to make the NA or unknown values consistent. Moreover, during initial data exploration, in the SUSP_SEX and VIC_SEX columns, there are uncommon and unknown values that our team needs to identify. Other than common “M”, “F,” representing male and female gender, there are other values such as “E,” “L,” “U.” Our team suspects “U” for unknown. However, no information is provided anywhere about the meaning of these abbreviations.
To conduct exploratory data analysis on this dataset, our team imported the data into R using the read_csv() function, since this dataset is publicly available for download in CSV format from the NYC Open Data website.
2.2 Missing value analysis
There are many columns with missing values after our team converts “Unknown” and “(null)” strings to NA’s. We left “U” in the gender columns as is for now since we have no evidence of it representing unknown.
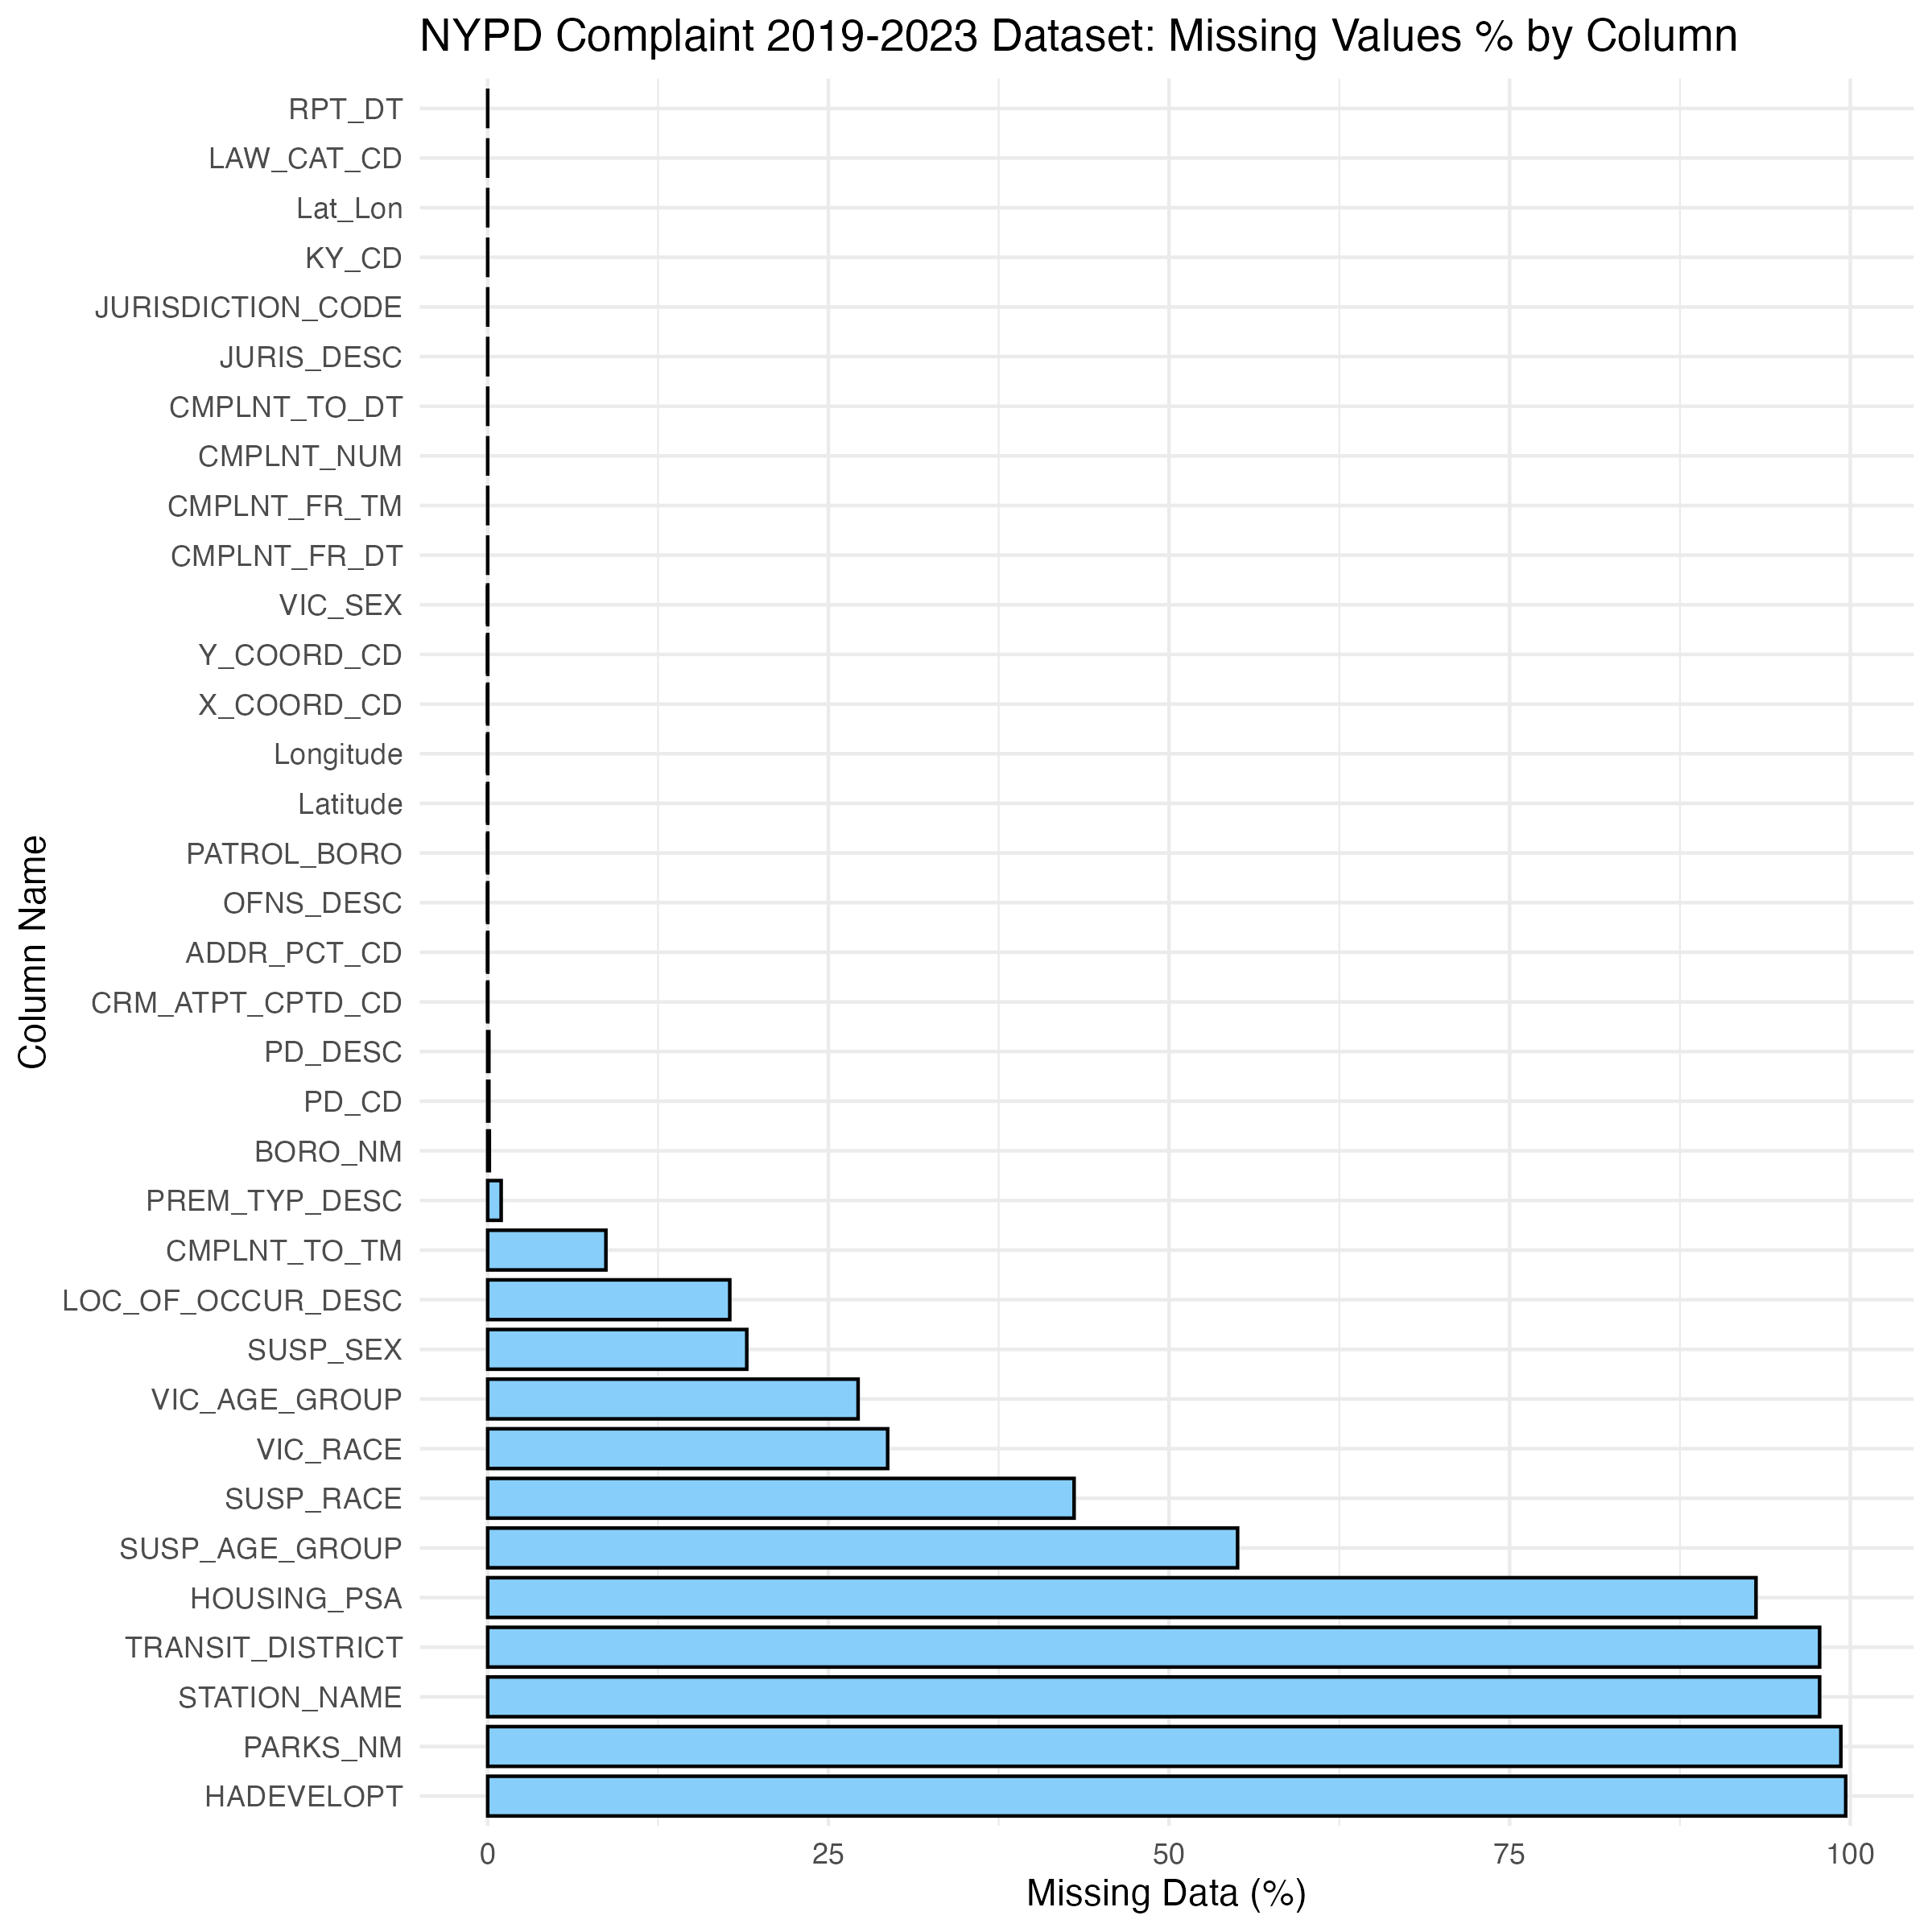
Out of the 35 columns, there are 10 columns containing no missing values, 13 columns having less than 1 percent missing values, 7 columns containing missing values in the range of 5% to 60%, and the remaining 5 columns containing missing values over 90%.
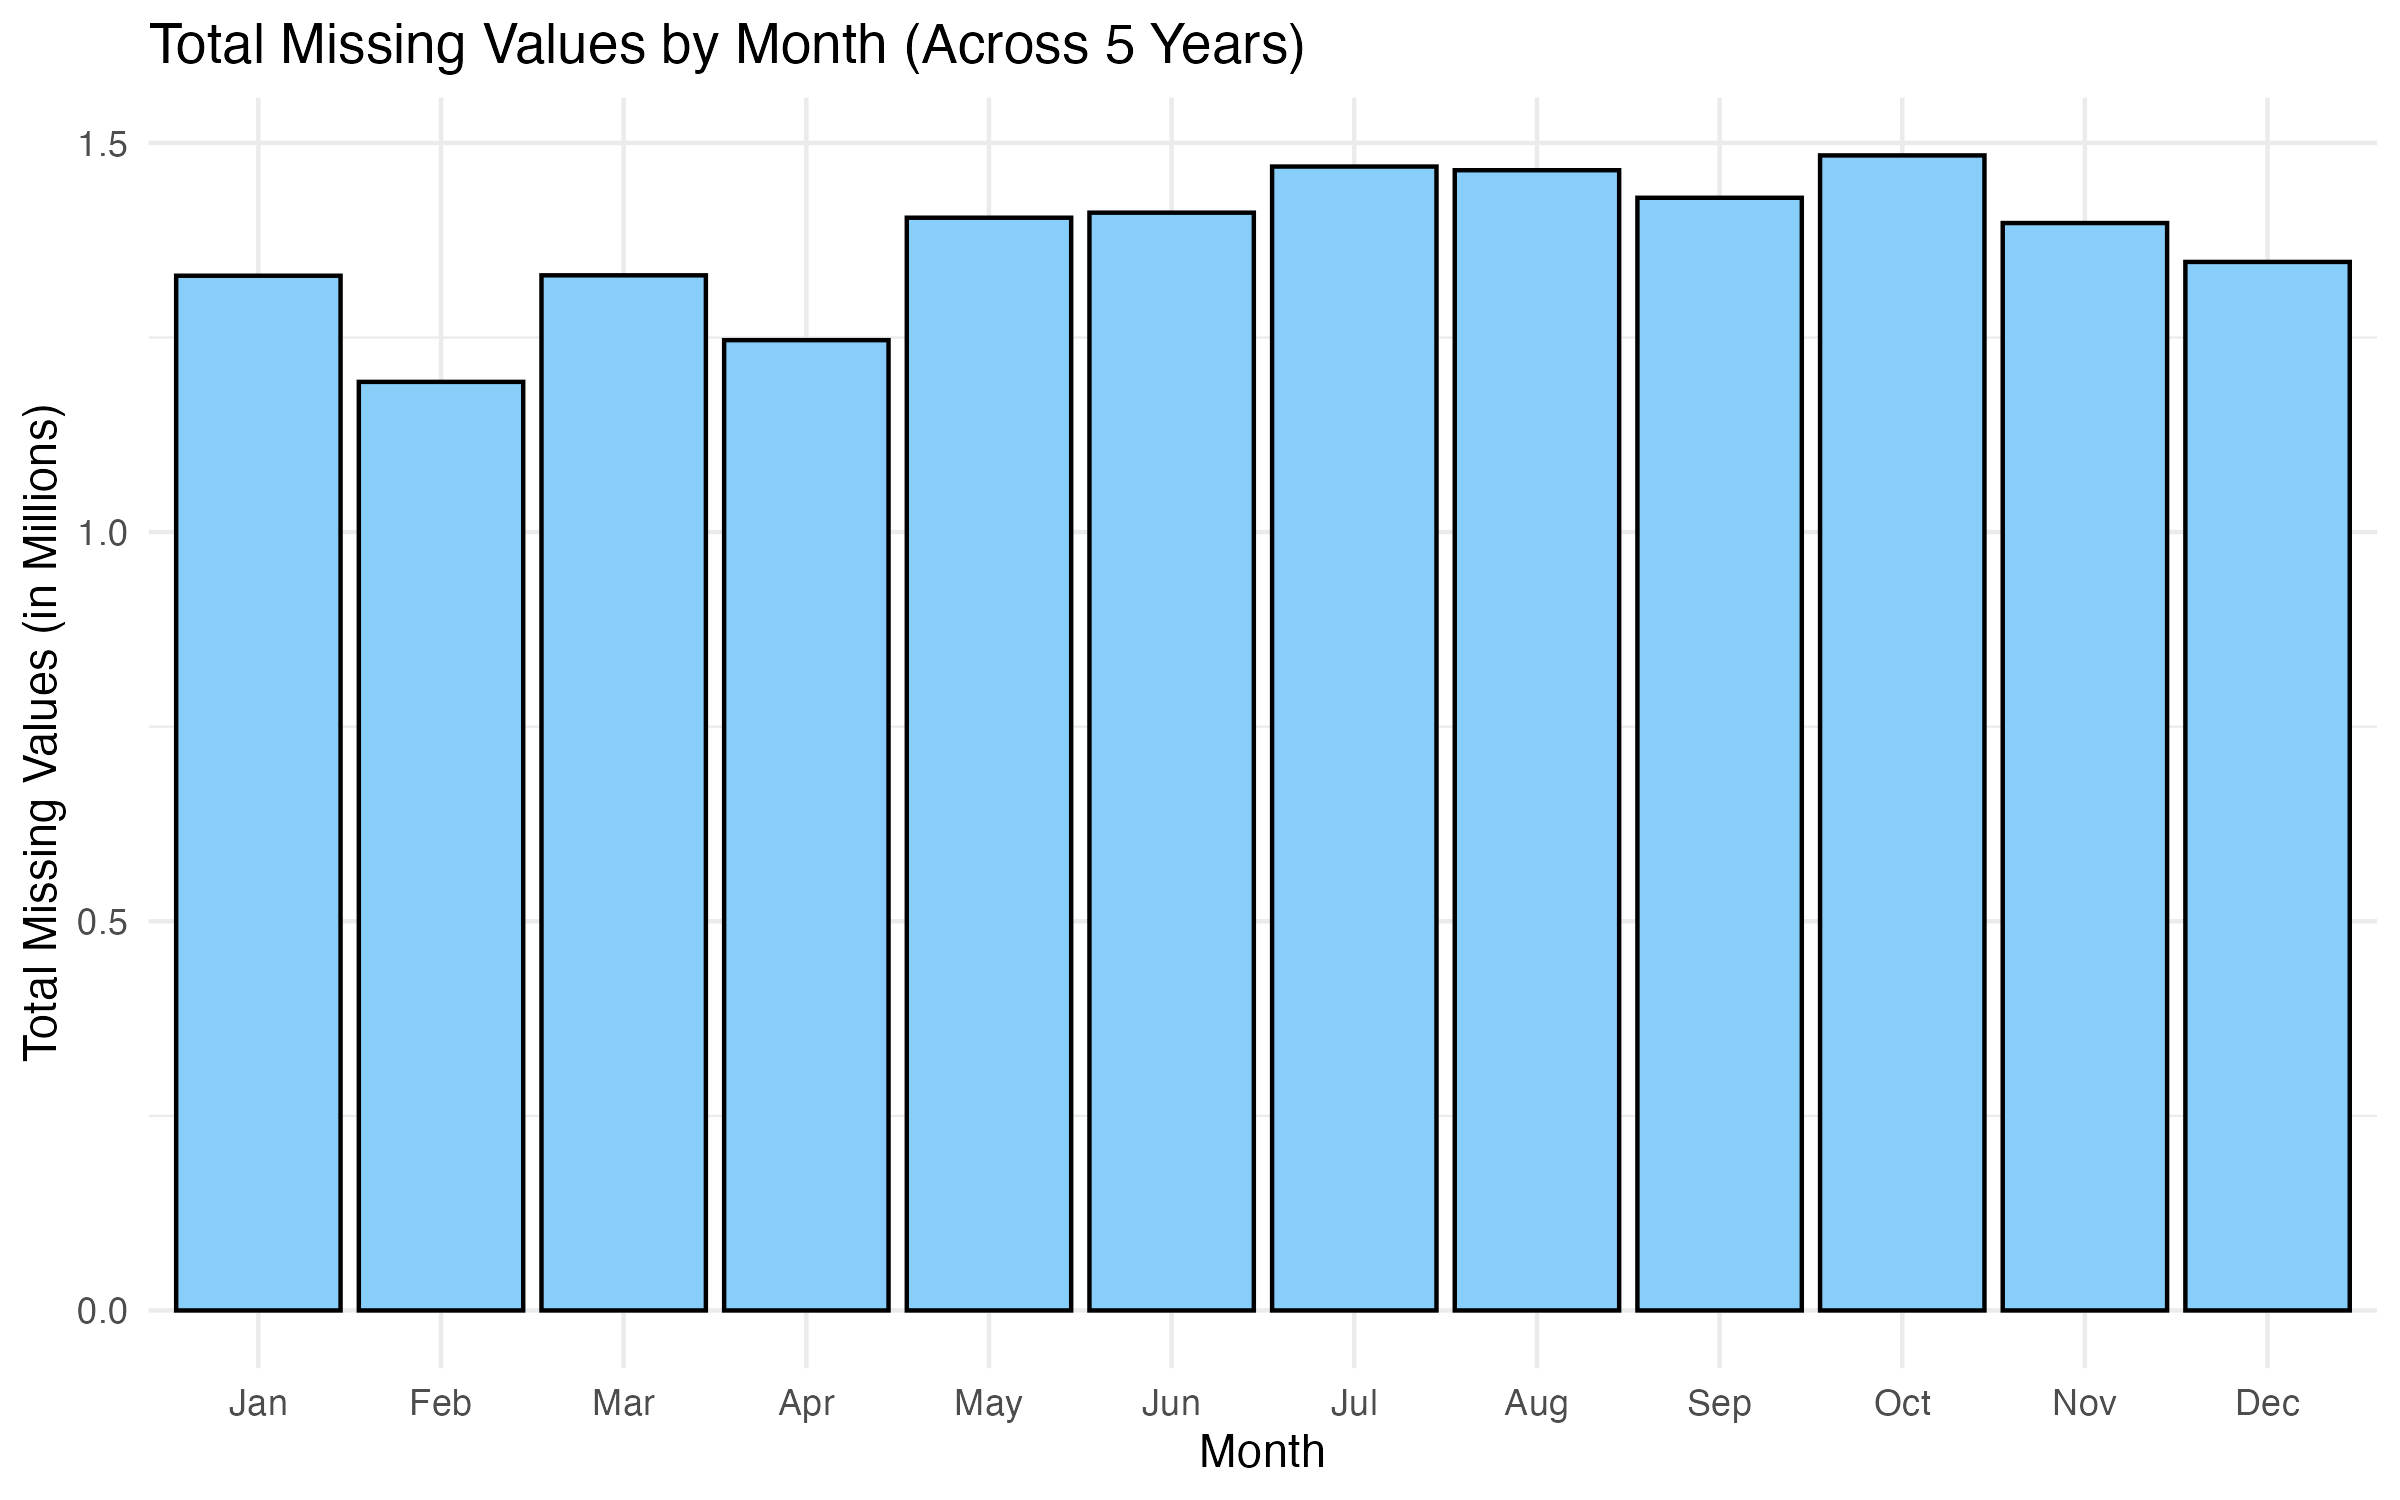
Across different months of the year, the number of missing values across all columns remains fairly consistent. The missing value count always falls at around 1 to 1.5 million for each month. Our team also notices that shorter months with 30 days or fewer generally have lower missing value counts compared to longer months with 31 days. However, an exception occurs toward the end of the year, where December has a lower missing value count compared to November.
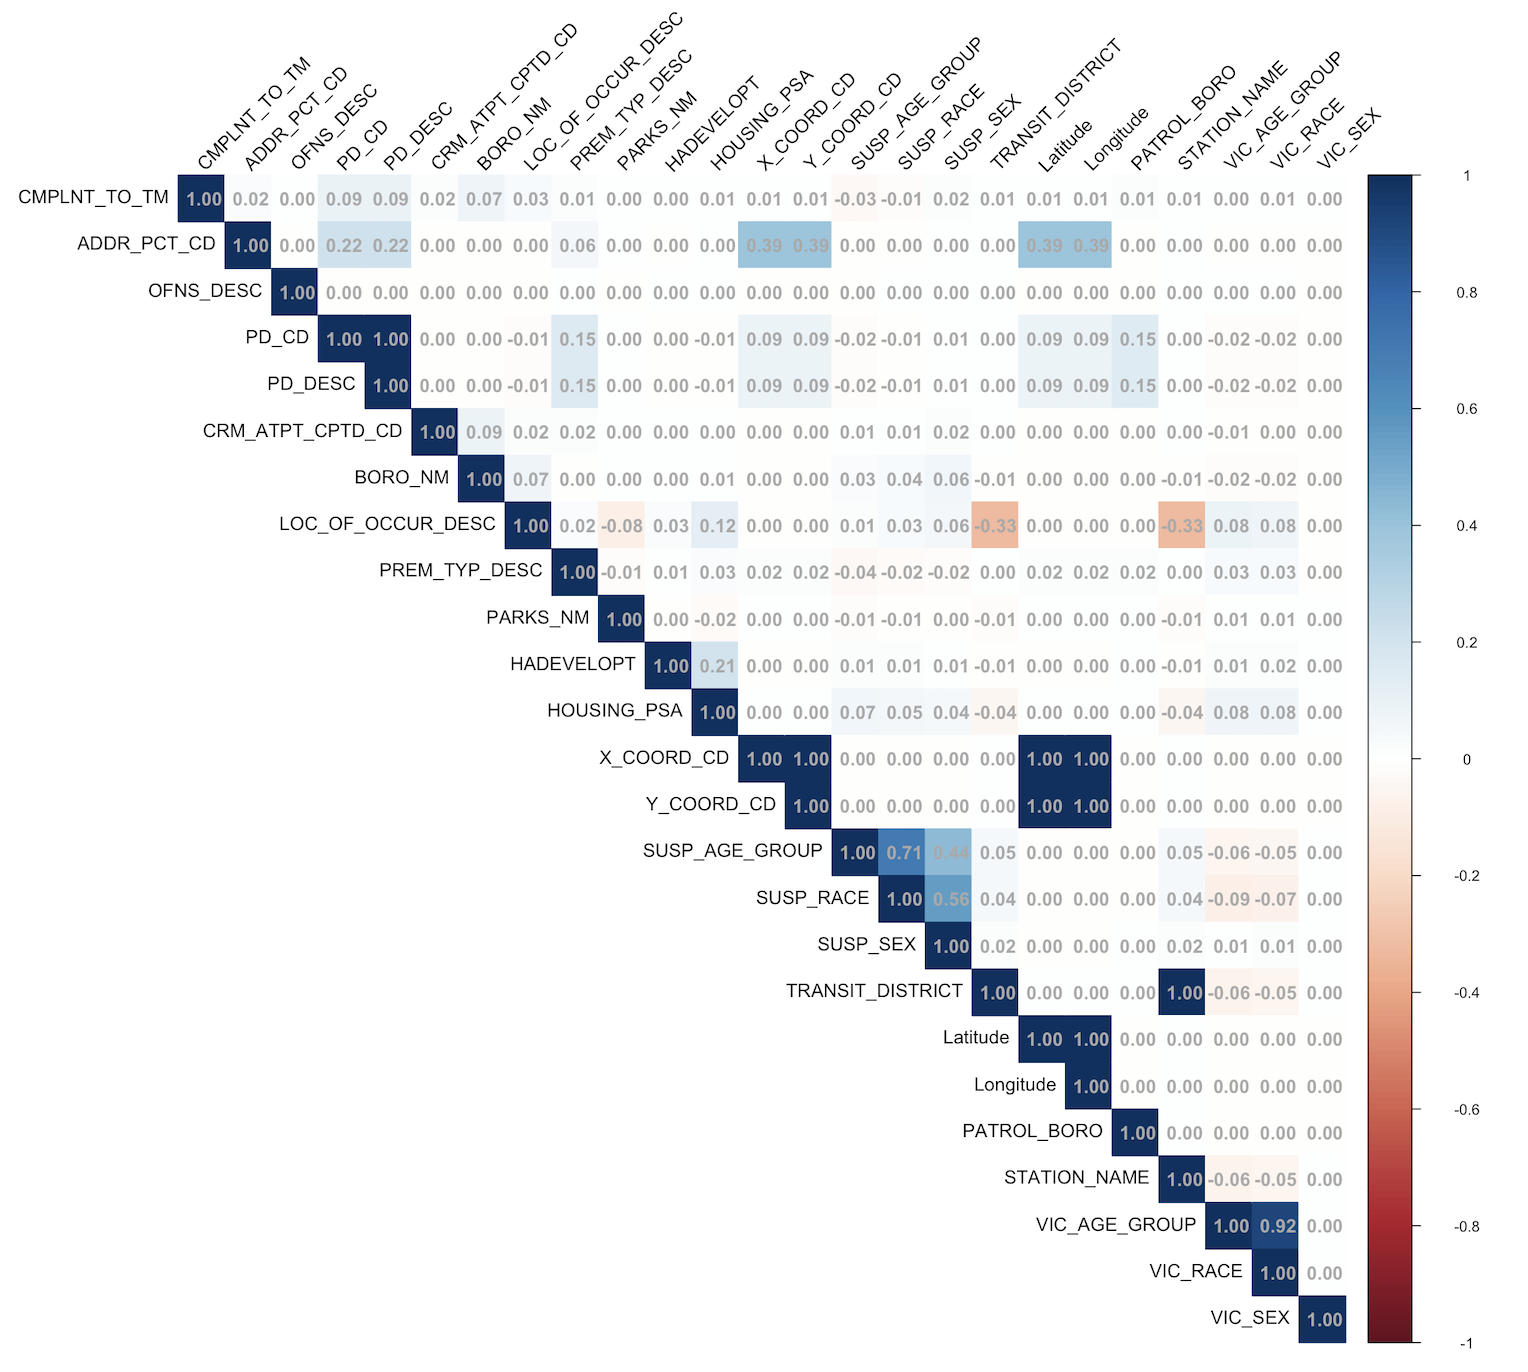
From the correlation coefficients of column missing values, we observe that when the X_COORD_CD or Y_COORD_CD values are missing, the LATITUDE and LONGITUDE values will always be missing. Moreover, when PD_CD values are missing, PD_DESC will also be missing; when TRANSIT_DISTRICT data is missing, the STATION_NAME information will also be missing. Furthermore, when VIC_AGE_GROUP is missing, it is very likely that the VIC_RACE information will be missing.
Note: Please refer to InitialAnalysis.qmd for detailed code implementation.