3 Result
Crime Over Time: Trends from 2019 to 2023
Yearly Crime Trends: The Pandemic’s Impact and Beyond
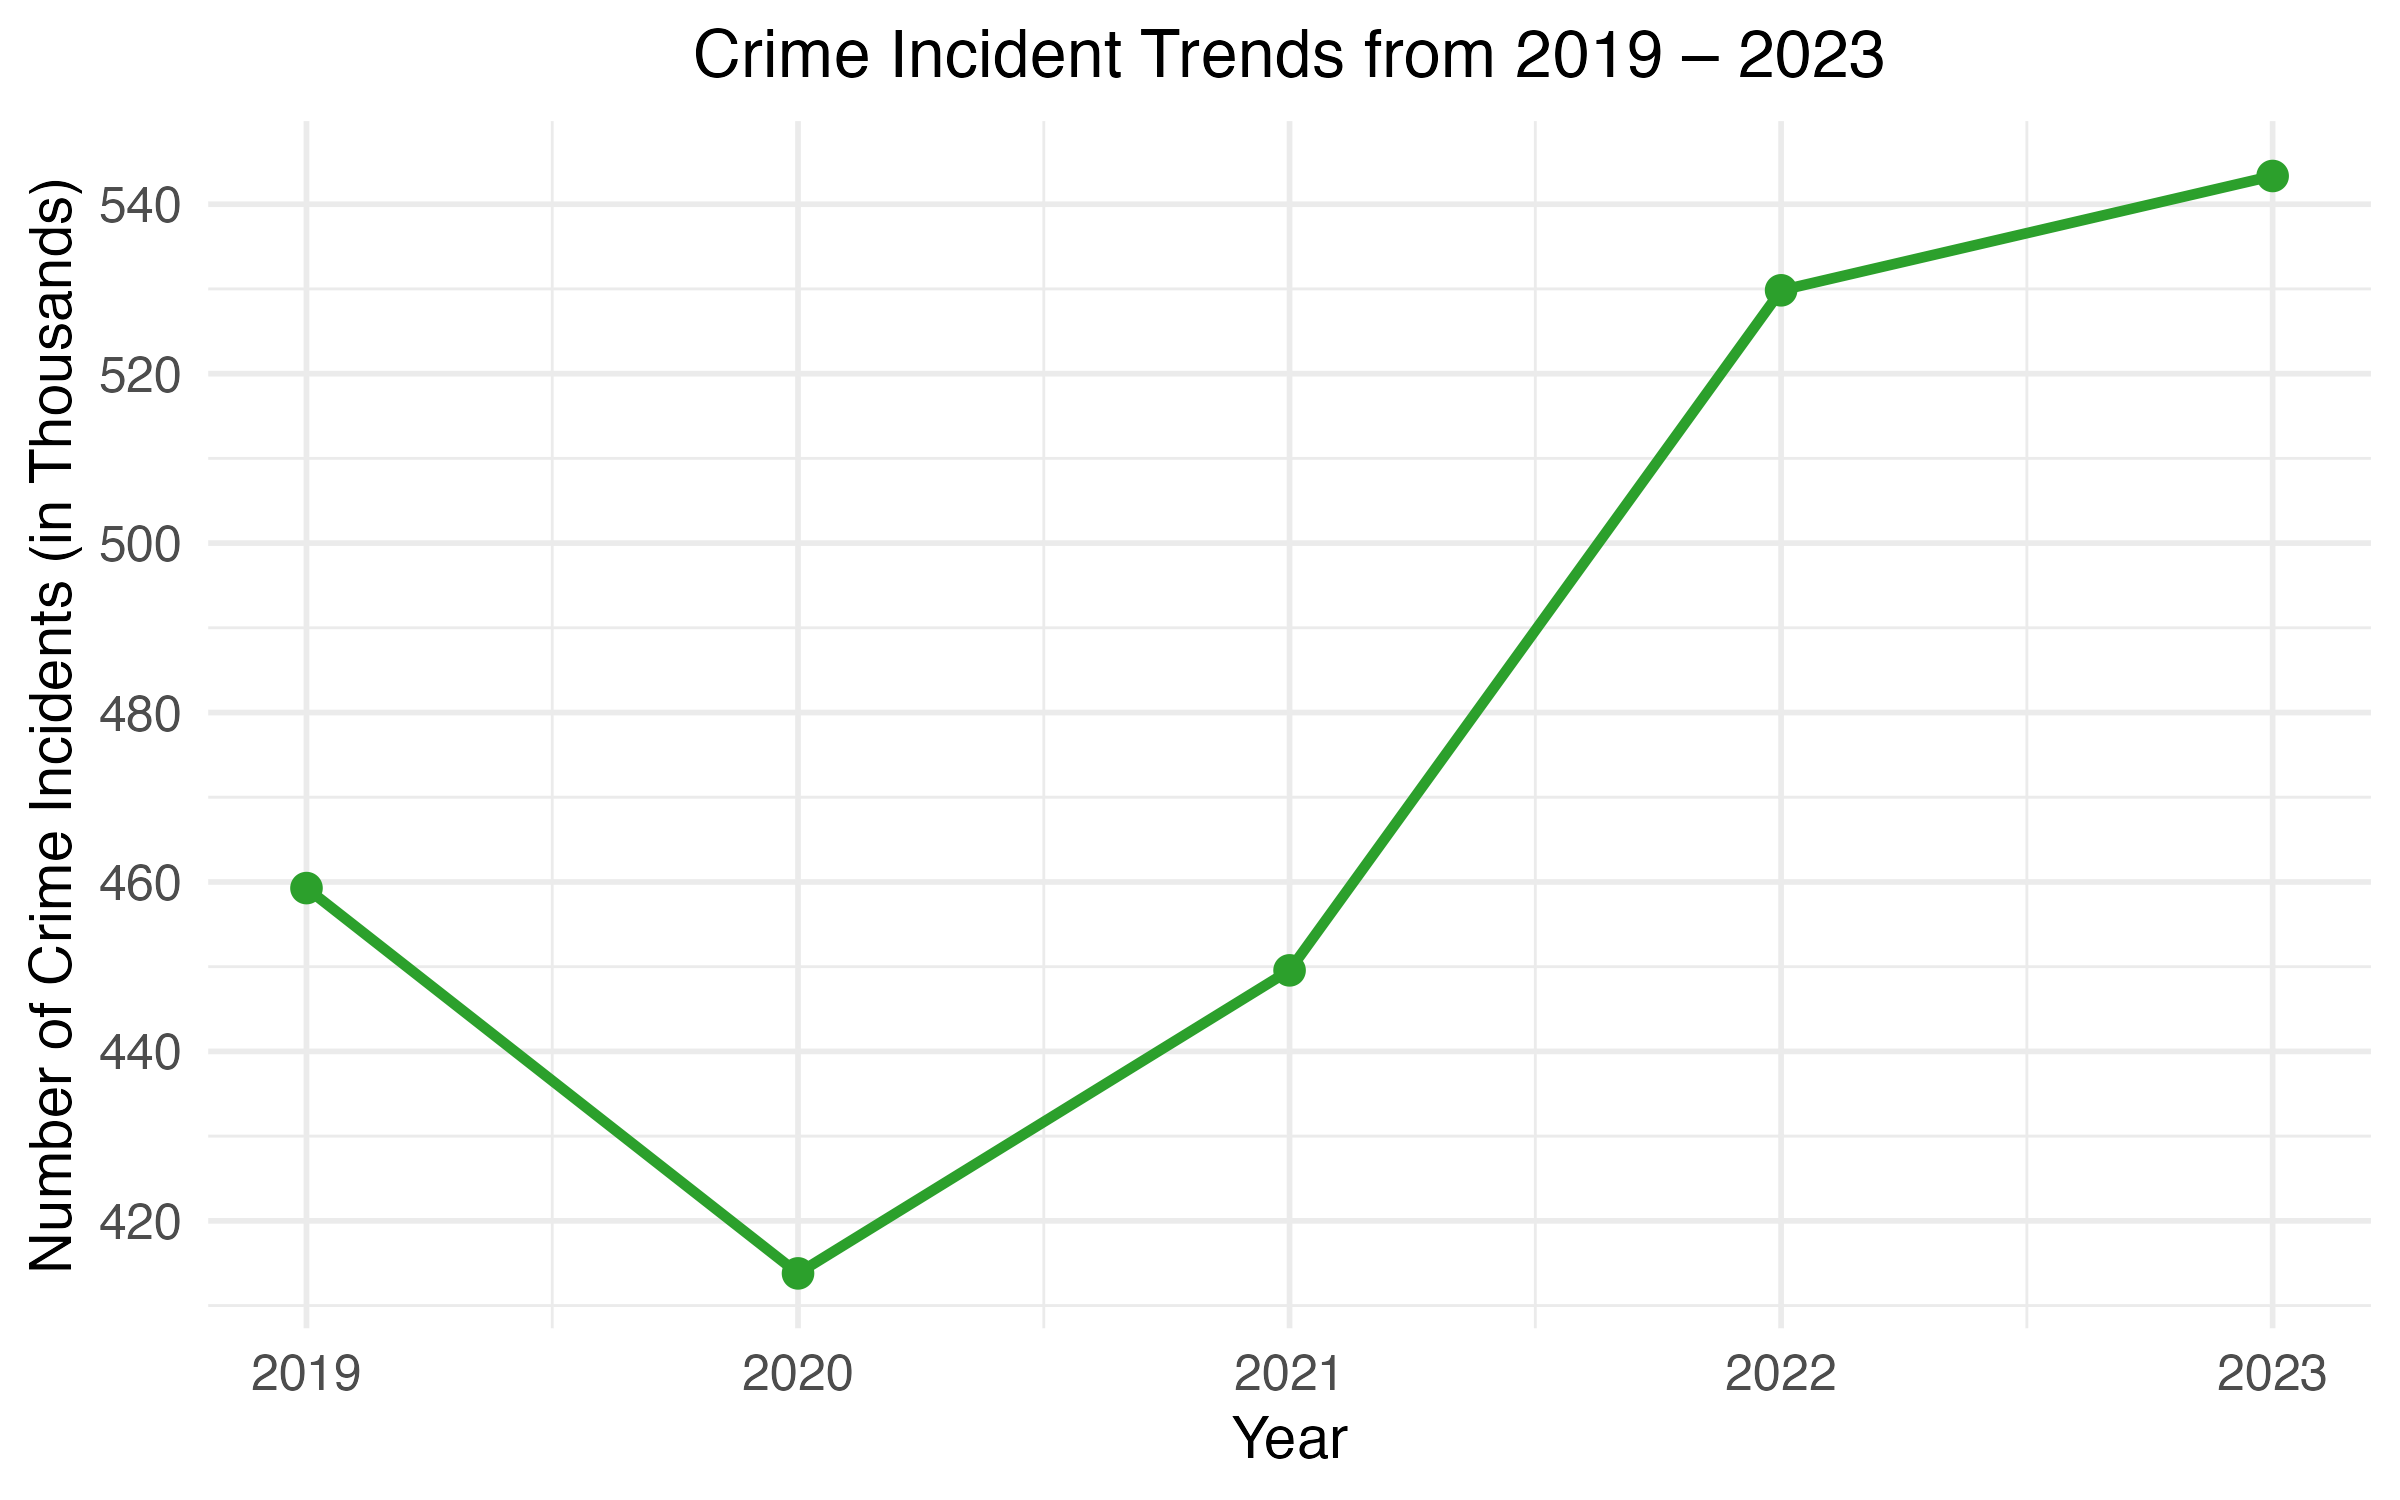
Beginning our exploration of crime patterns in New York City, we start with a yearly analysis of crime incidents over the past five years (Figure 1). As shown in the yearly line graph, in 2019, there were approximately 460,000 reported crime incidents. The following year, 2020, saw a significant decline, with the number of incidents dropping to around 418,000. This reduction was likely influenced by the unprecedented circumstances of the COVID-19 pandemic, where stringent lockdowns and reduced public interactions curtailed opportunities for criminal activity. As the city adapted and began to recover from the pandemic, crime rates started to climb. In 2021, the number of reported incidents increased to approximately 460,000, matching pre-pandemic levels. This upward trend continued into 2022, with reported incidents rising further to about 500,000. By 2023, the figure reached a peak of around 545,000.The line graph highlights the clear increase in crime incidents over the past few years and underscores the need for the allocation of additional police resources, alongside the development of comprehensive policies that address the root causes of crime.
The Borough Perspective: Where Crime Has Changed the Most:
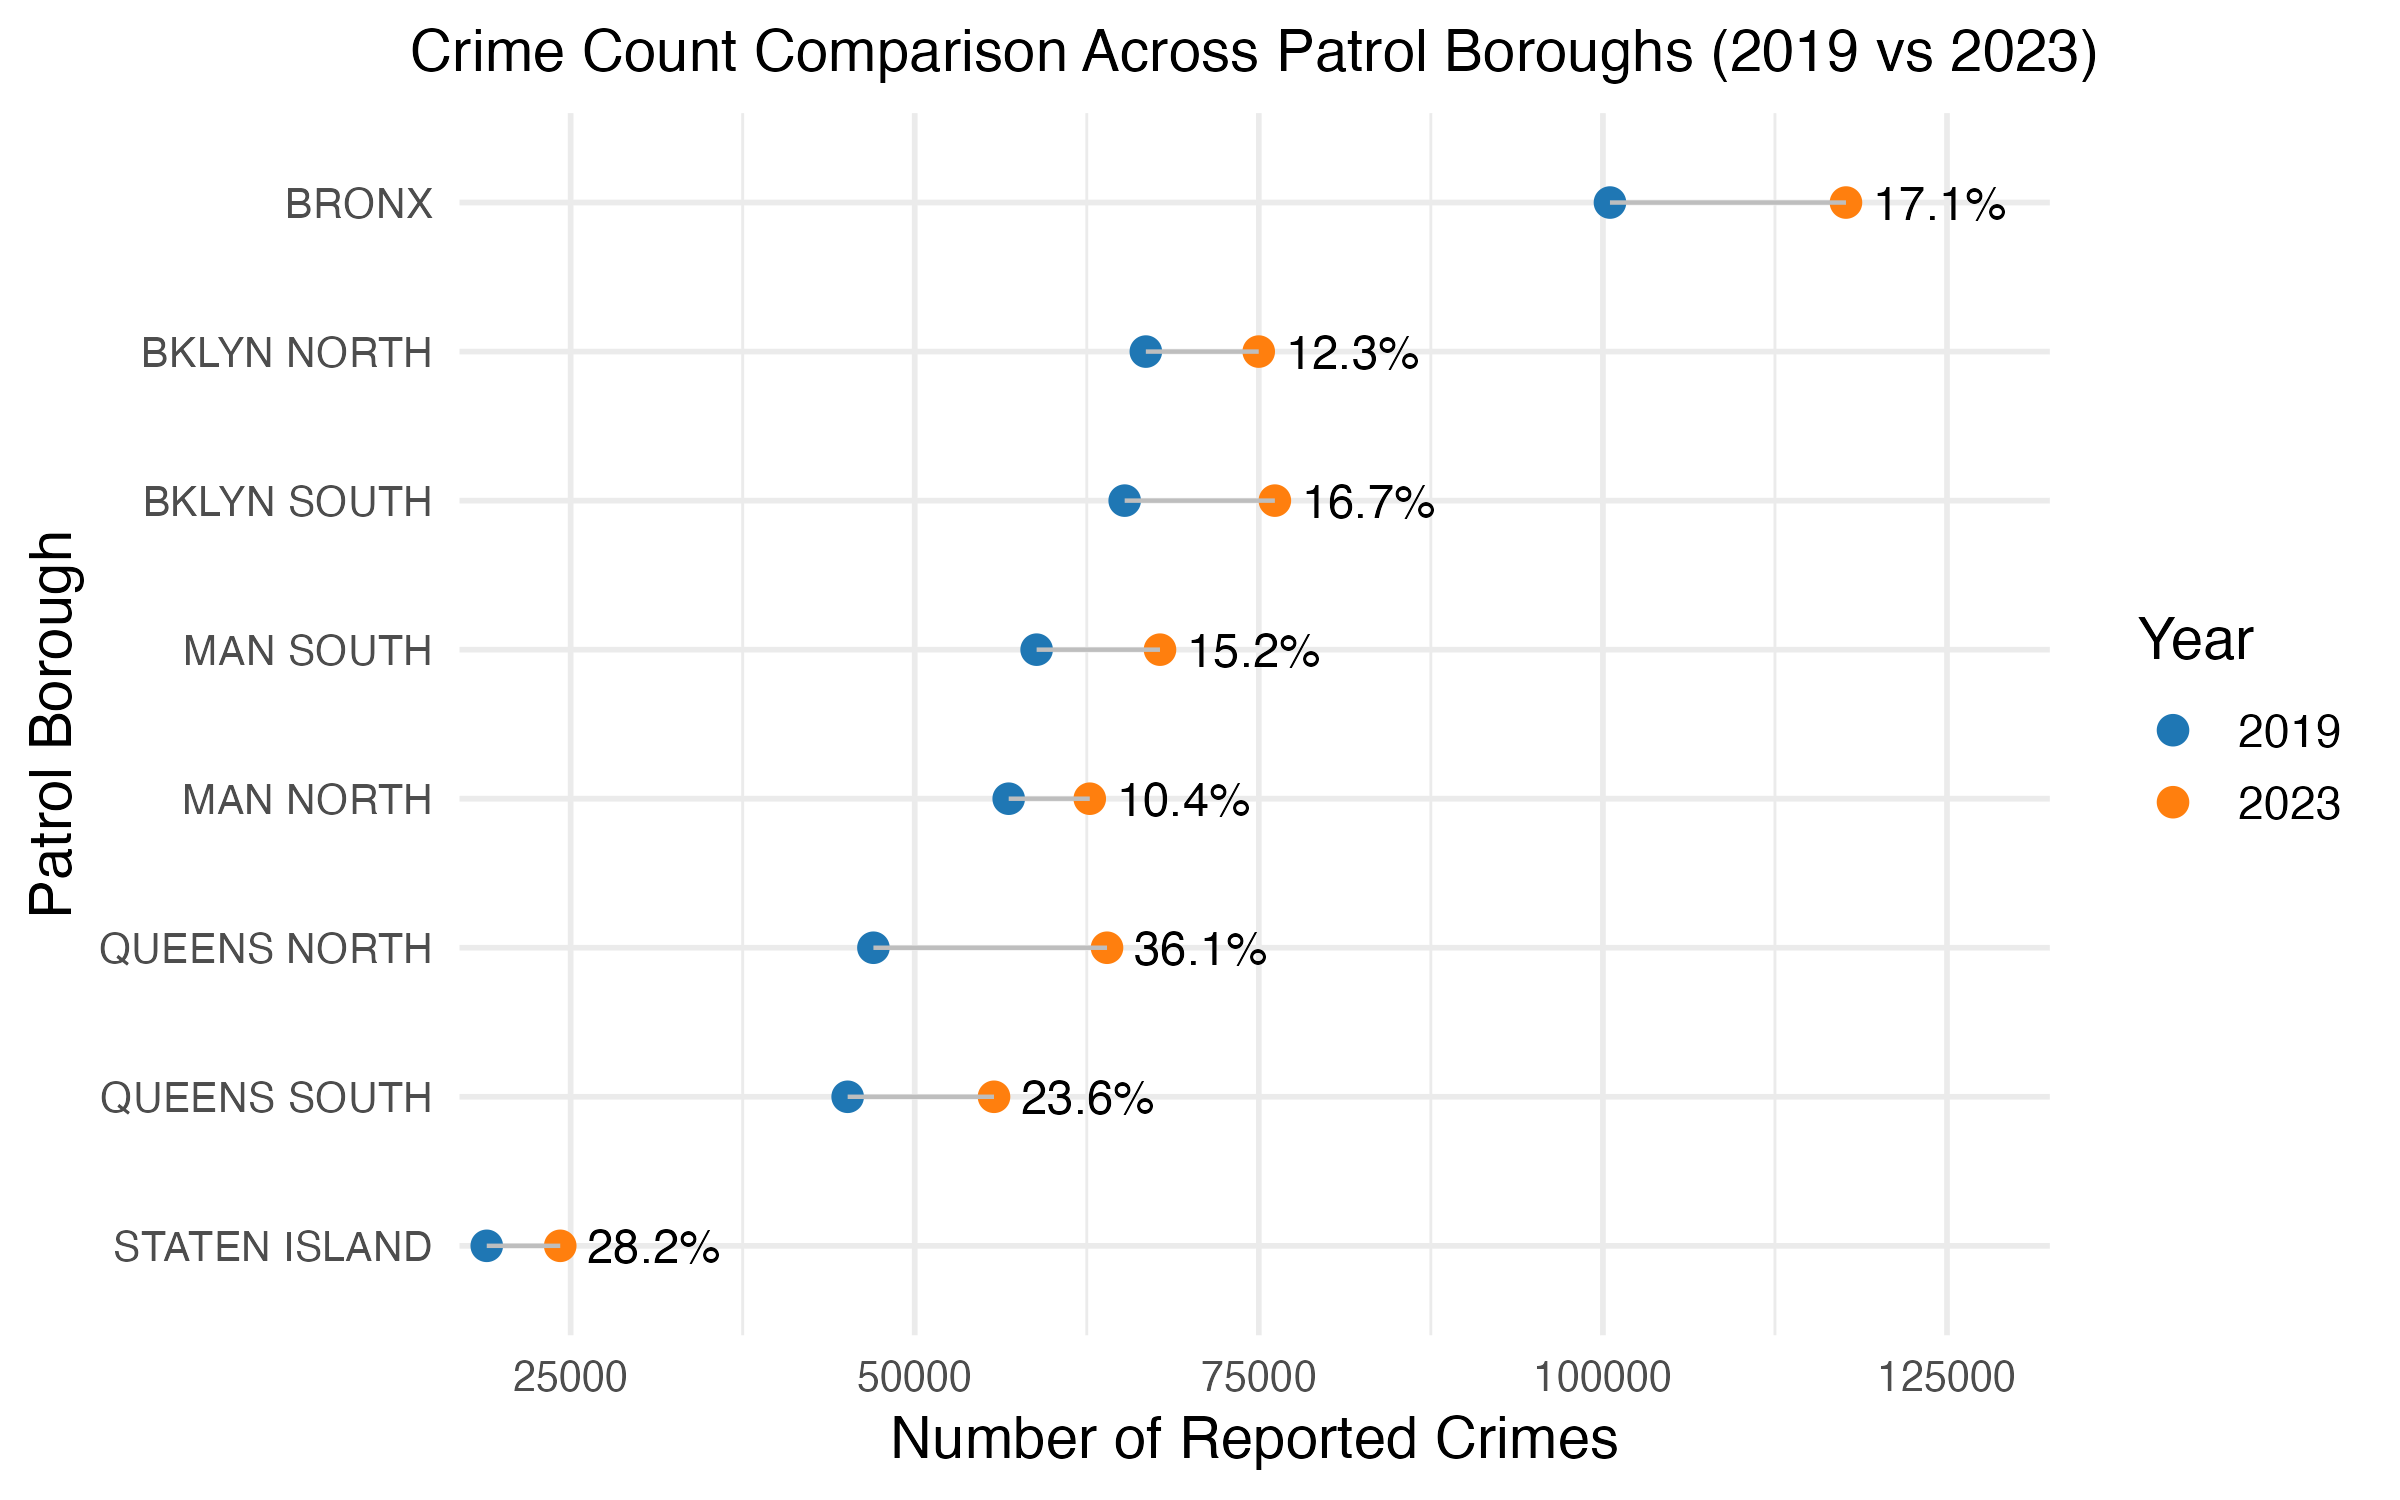
To delve deeper into the observed increase in crime incidents, we next examine the distribution of reported crimes across the eight patrol boroughs in New York City. By comparing data from 2019 and 2023, we aim to identify which boroughs experienced the most significant changes and how the increase in crime is distributed geographically (Figure 2). This analysis provides a more localized perspective on borough-specific trends. As shown in the graph, Queens North recorded the most significant percentage increase, with crime incidents rising by 36.1% between 2019 and 2023. Staten Island followed with a 28.2% increase, and Queens South saw a 23.6% rise. However, when considering the absolute number of incidents, the Bronx stands out, despite its percentage increase of 17.1% not being the highest. The Bronx’s substantial base number of reported crimes in 2019 means it contributed the largest absolute increase in crime incidents over the four years. Similarly, Brooklyn North and Brooklyn South, with percentage increases of 16.7% and 12.3%, respectively, also saw significant absolute rises due to their relatively high baseline crime numbers in 2019. Meanwhile, Manhattan South and Manhattan North, despite their percentage increases of 10.4% and 15.2%, respectively, contributed smaller absolute increases compared to other boroughs due to their lower initial figures.
Seasonality Matters: Monthly Crime Trends Across the Boroughs:
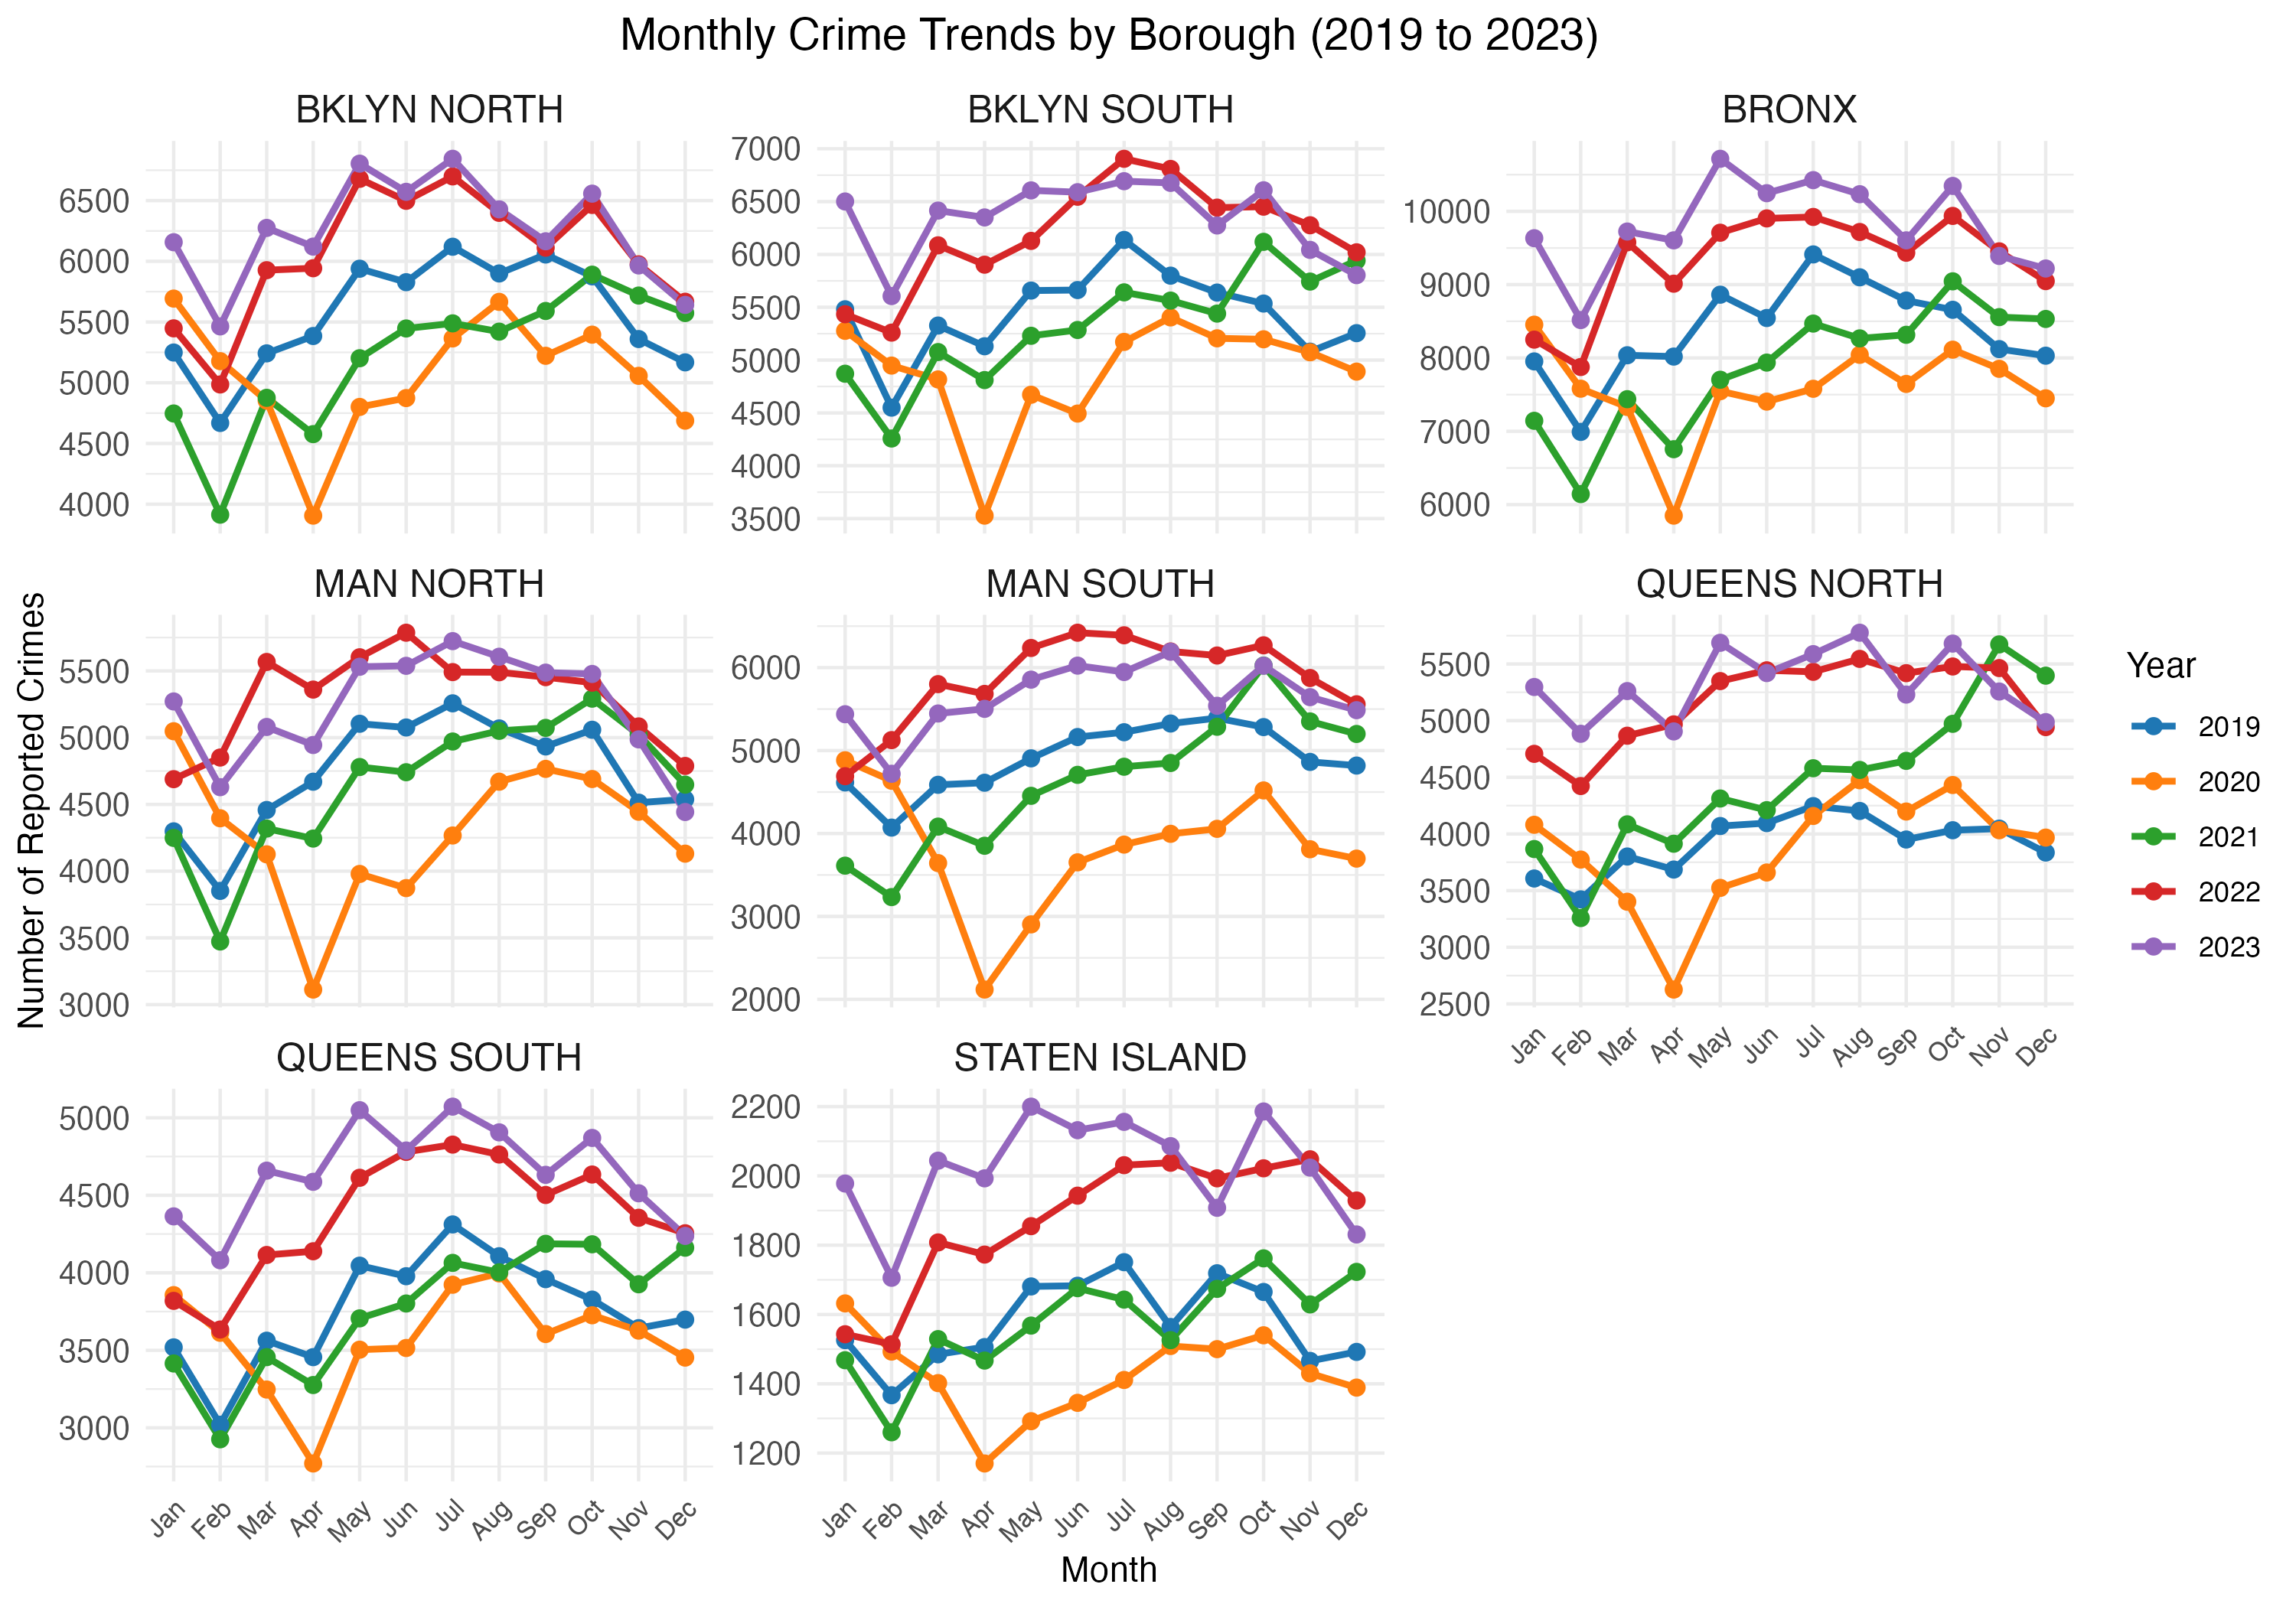
While the yearly trends provide a high-level overview of the rise in crime incidents, they fail to capture the temporal variations that occur within each year. To better understand the dynamics of crime, monthly crime trends were plotted for each borough from 2019 to 2023 (Figure 3). Interestingly, most boroughs show a seasonal trend where crime rates tend to rise in the warmer months (June to August) and decline slightly toward the end of the year. February generally records fewer crime incidents compared to other months, with all boroughs showing a noticeable drop in reported crimes during this period. These seasonal patterns held consistent across all five years and suggest that external factors, such as weather, public holidays, and changes in societal behaviors, play a significant role in influencing crime levels throughout the year. Additionally, across most boroughs, crime incidents exhibited a notable dip during the early months of 2020, reflecting the impact of strict COVID-19 lockdown measures.
A Closer Look at 2023: Insights from the Most Recent Data:
Weekly Crime Patterns: Borough Insights for 2023
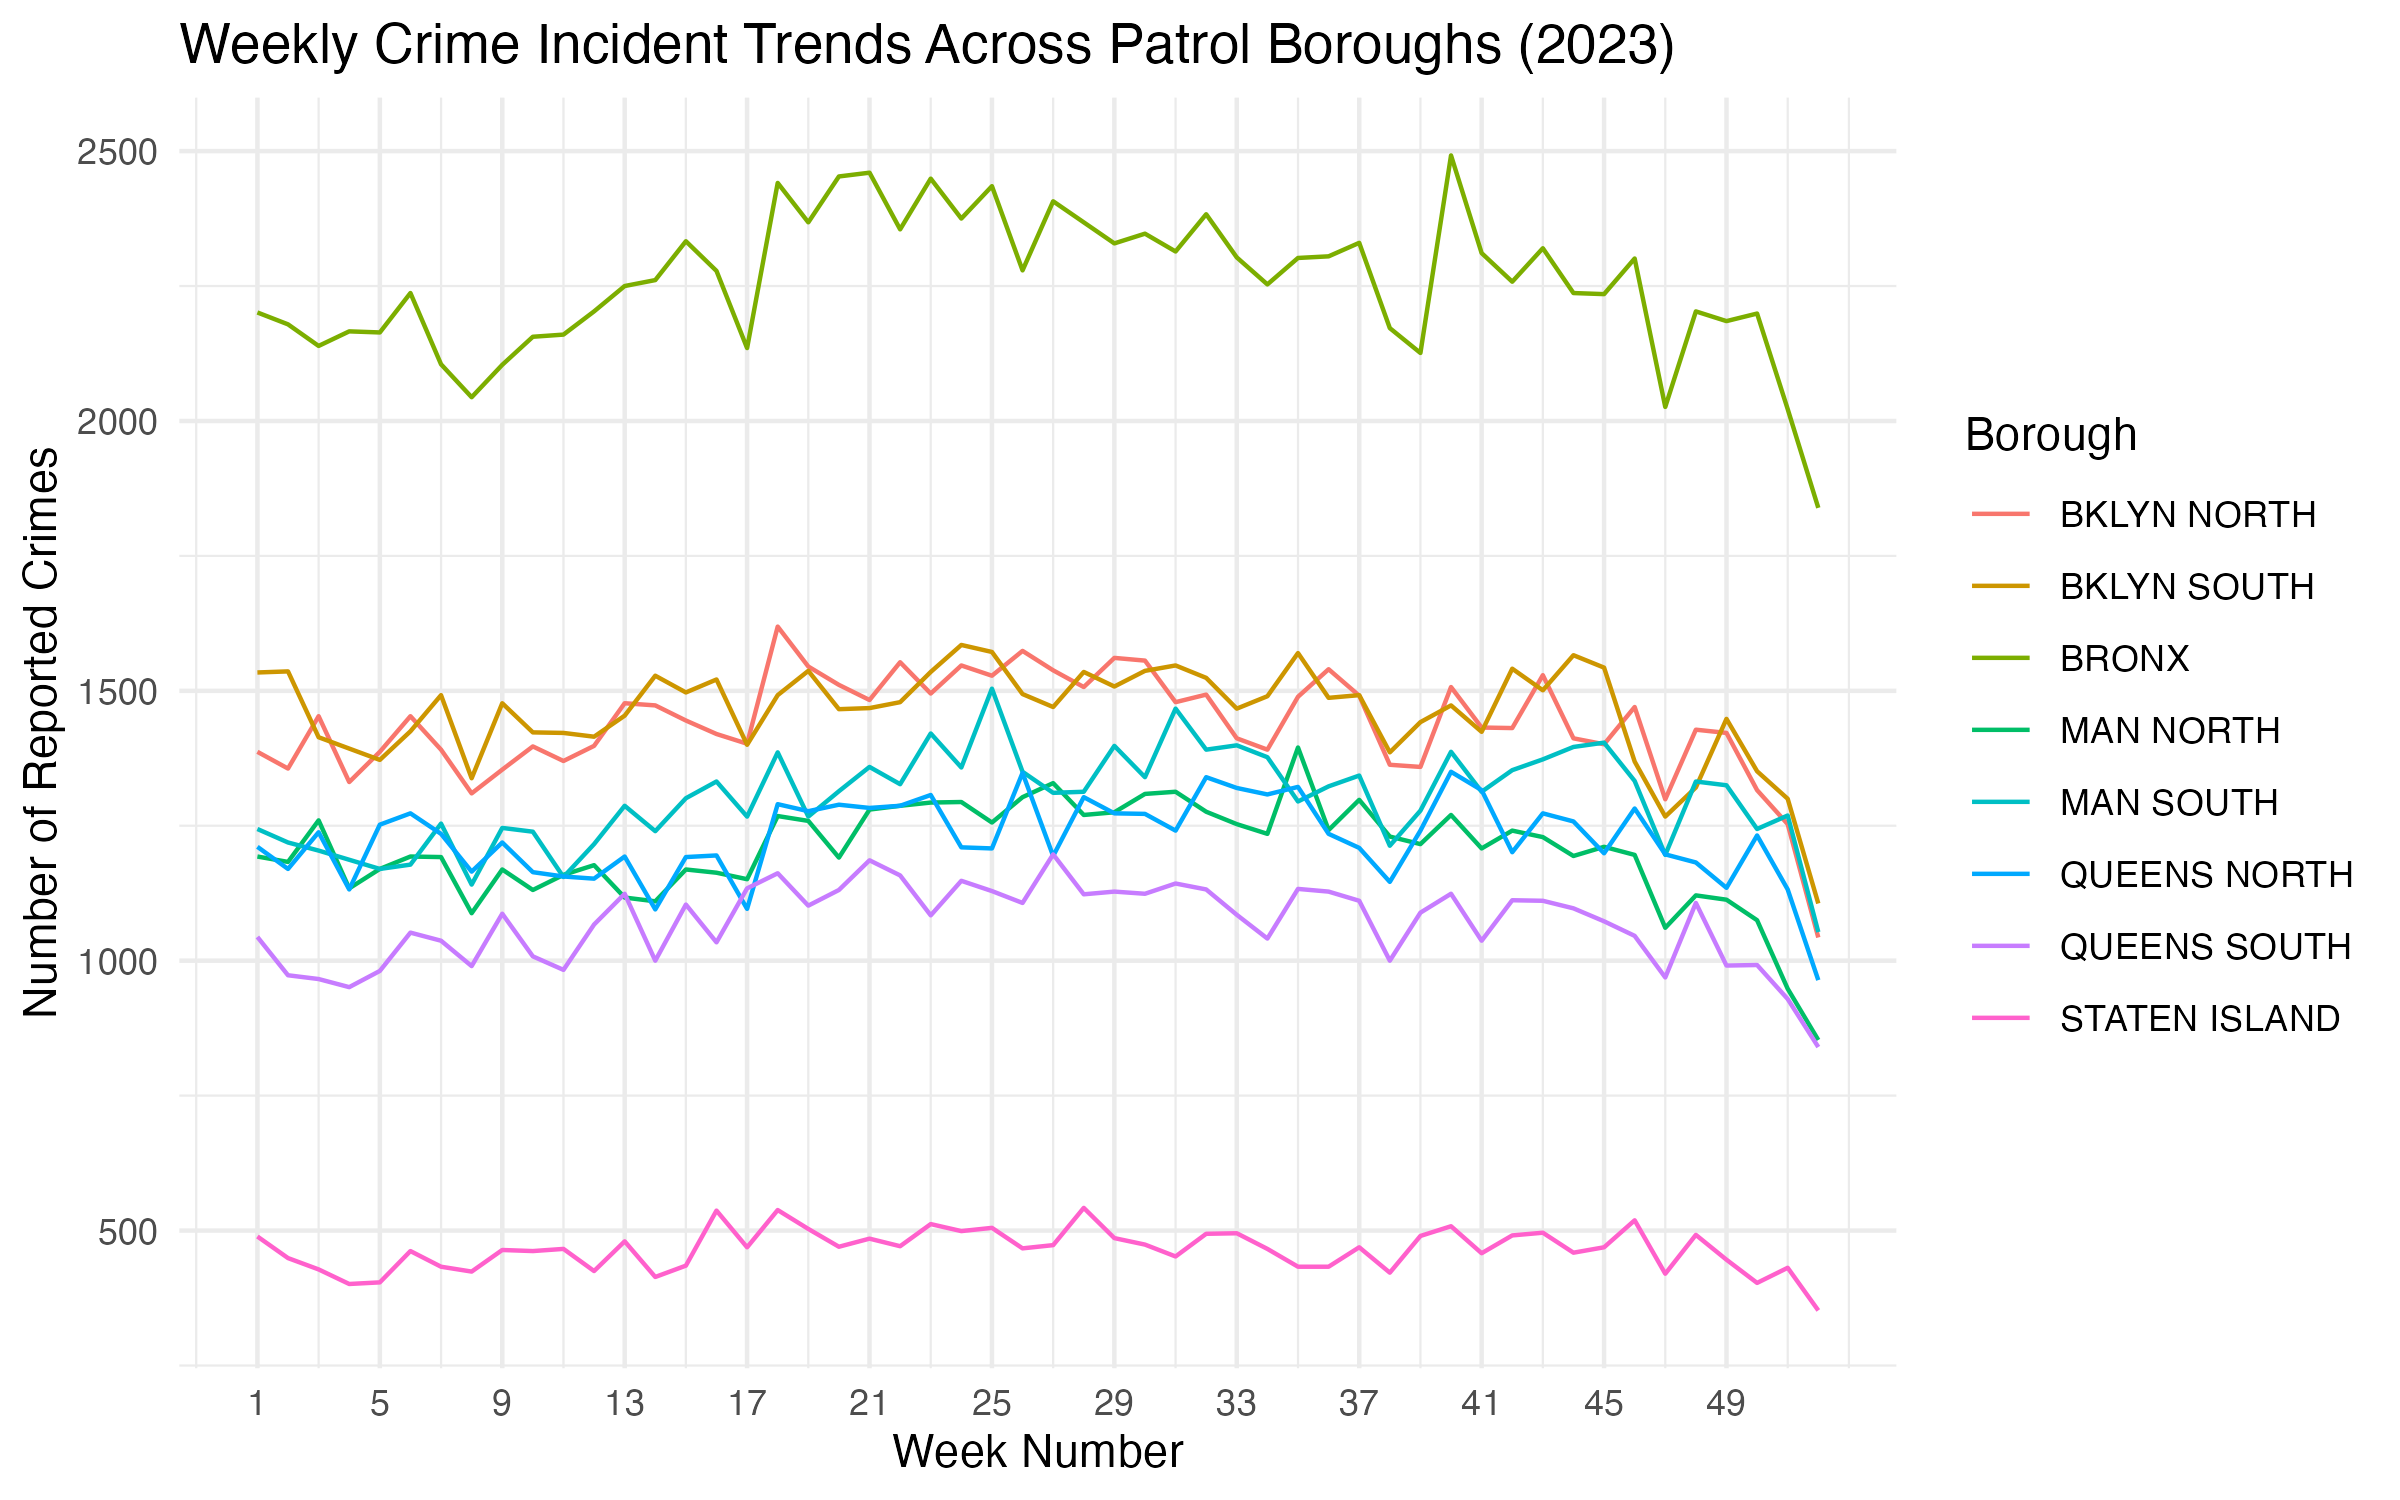
Having explored the general crime trends over the past five years, we now shift our focus to a more detailed examination of the most recent year, 2023. By analyzing weekly crime data (Figure 4), we gain insights into the short-term fluctuations and patterns that characterize crime incidents across the boroughs in this year. As shown in Figure 4, the Bronx stands out as the borough with the highest weekly crime counts, maintaining a significantly elevated level compared to other boroughs throughout the year. Brooklyn North and Brooklyn South follow closely, while boroughs such as Queens South and Staten Island consistently report lower weekly crime incidents. Interestingly, the graph highlights periodic fluctuations in weekly crime rates, particularly during the summer months, which align with the seasonal peak observed in the monthly analysis. Additionally, the latter part of the year sees a gradual decline in weekly crime incidents across most boroughs.
Crime Hour by Hour: Daily Rhythms Across Boroughs
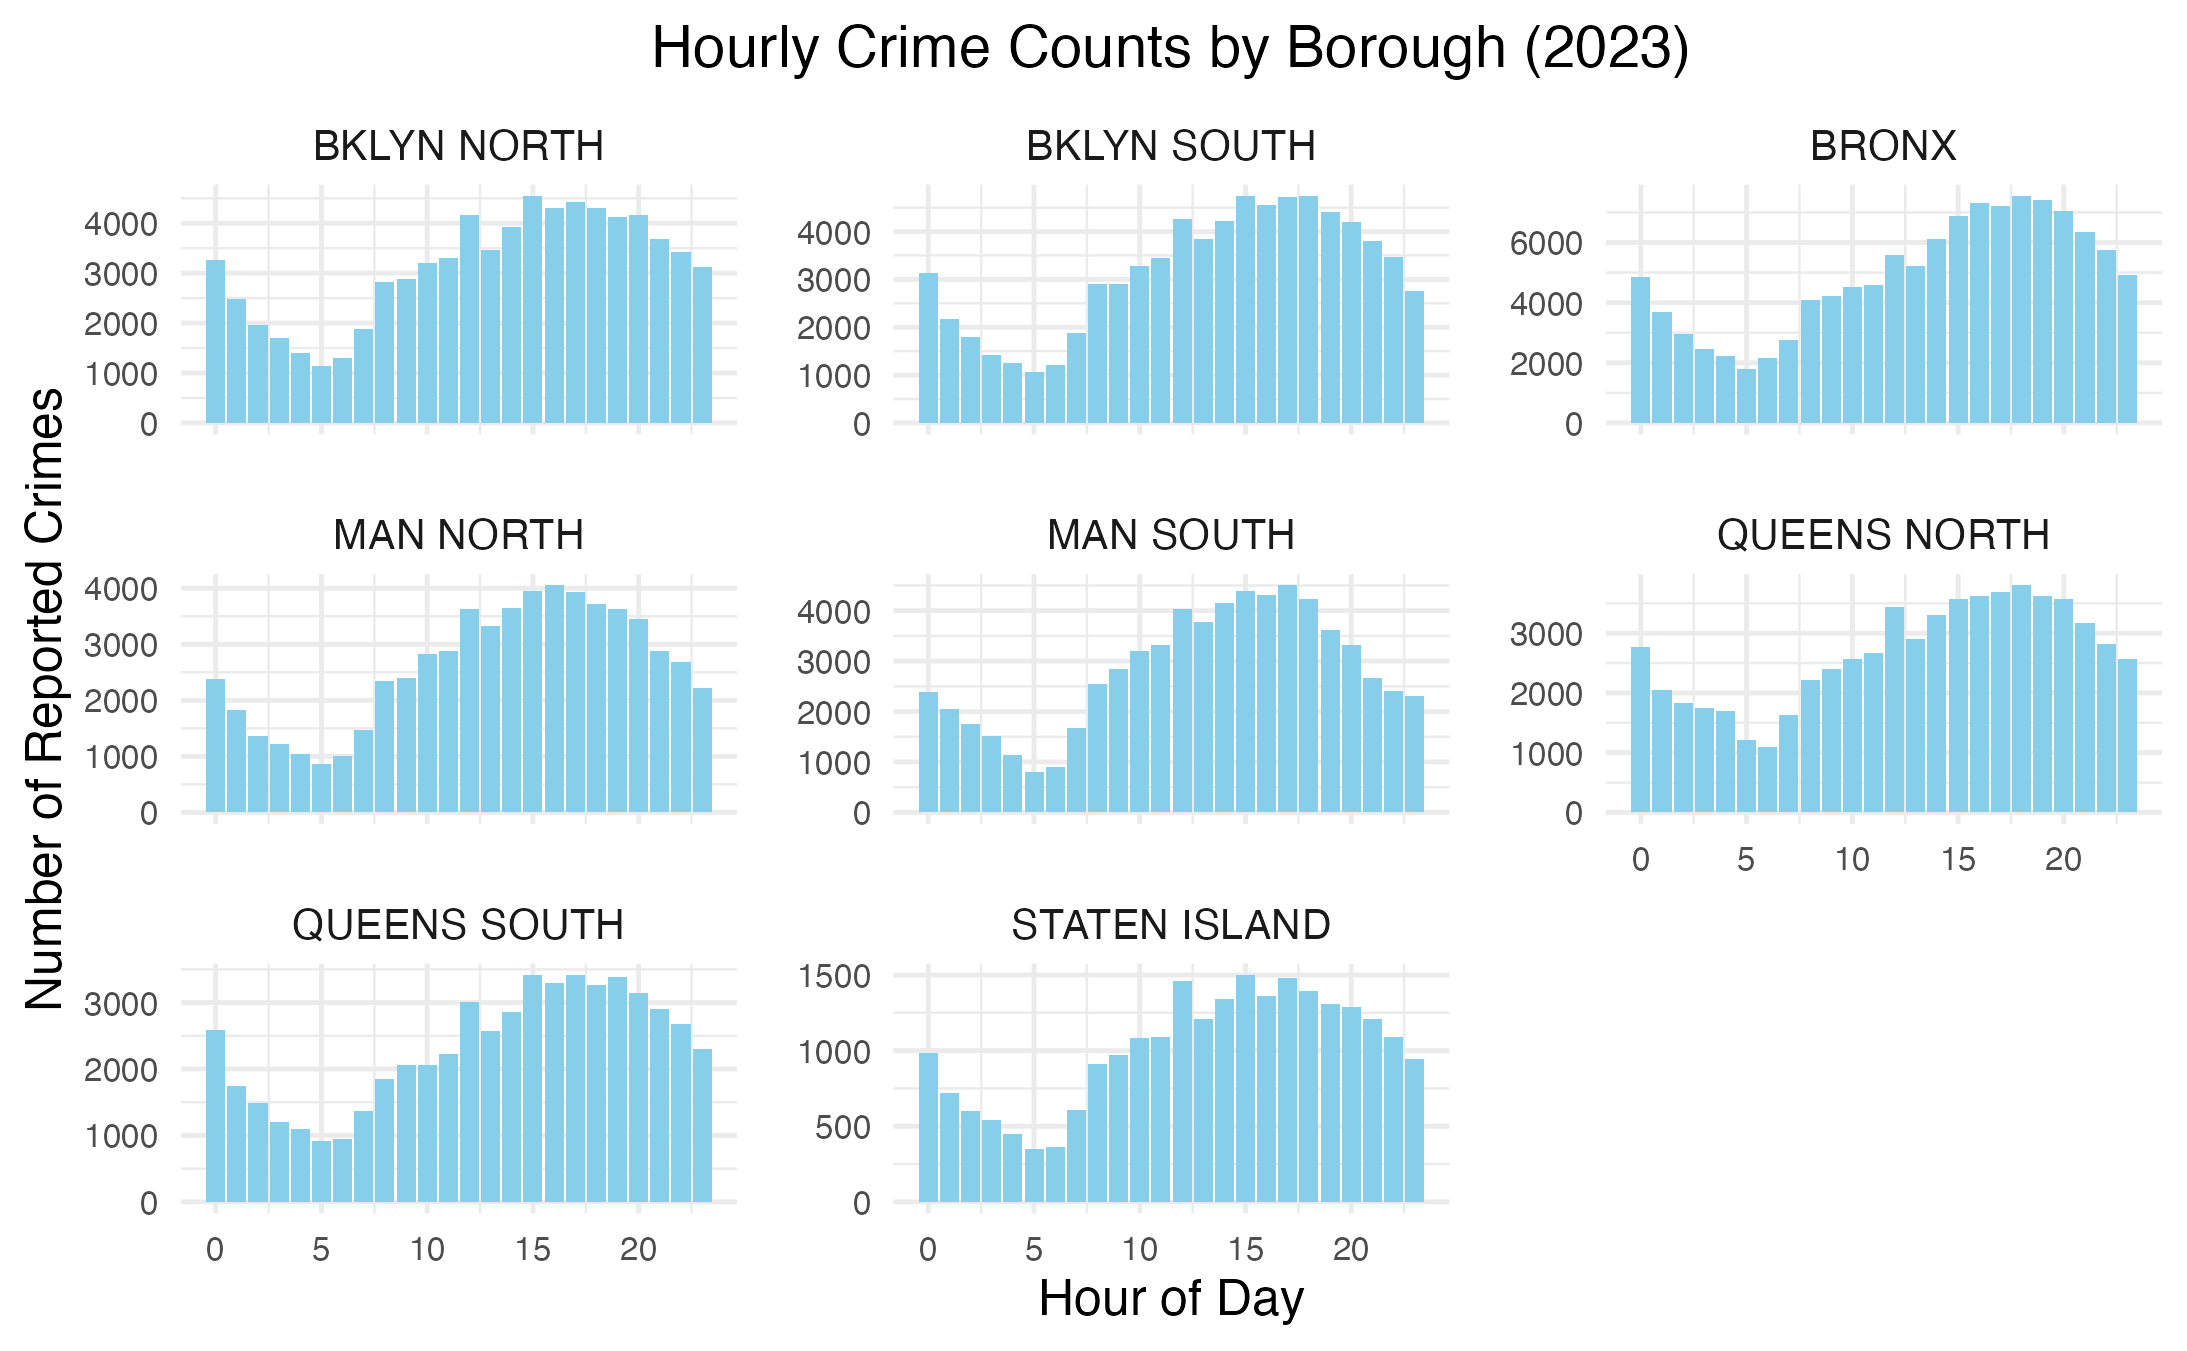
Beyond weekly patterns, a more detailed analysis of hourly trends can help us understand the daily rhythms of crime and how they vary across different boroughs in 2023. As illustrated in Figure 5, a consistent hourly pattern emerges across all boroughs. Crime rates gradually decrease from midnight (12 AM) to the early morning hours (6 AM), reaching their lowest levels during this period. Following this, crime incidents steadily rise throughout the day, peaking during the late afternoon and evening hours (3 PM to 8 PM). This pattern aligns with typical daily activity cycles, where increased public interactions and greater movement of people likely lead to higher crime rates during these hours.
Where Crime Happens: Patterns by Premises Type
Having explored how crime fluctuates by hour across boroughs, we now turn our attention to how these incidents vary by premises type. By grouping crimes based on the type of location where they occurred (Figure 6), we can better understand how different environments influence the timing and density of criminal activity throughout the day.
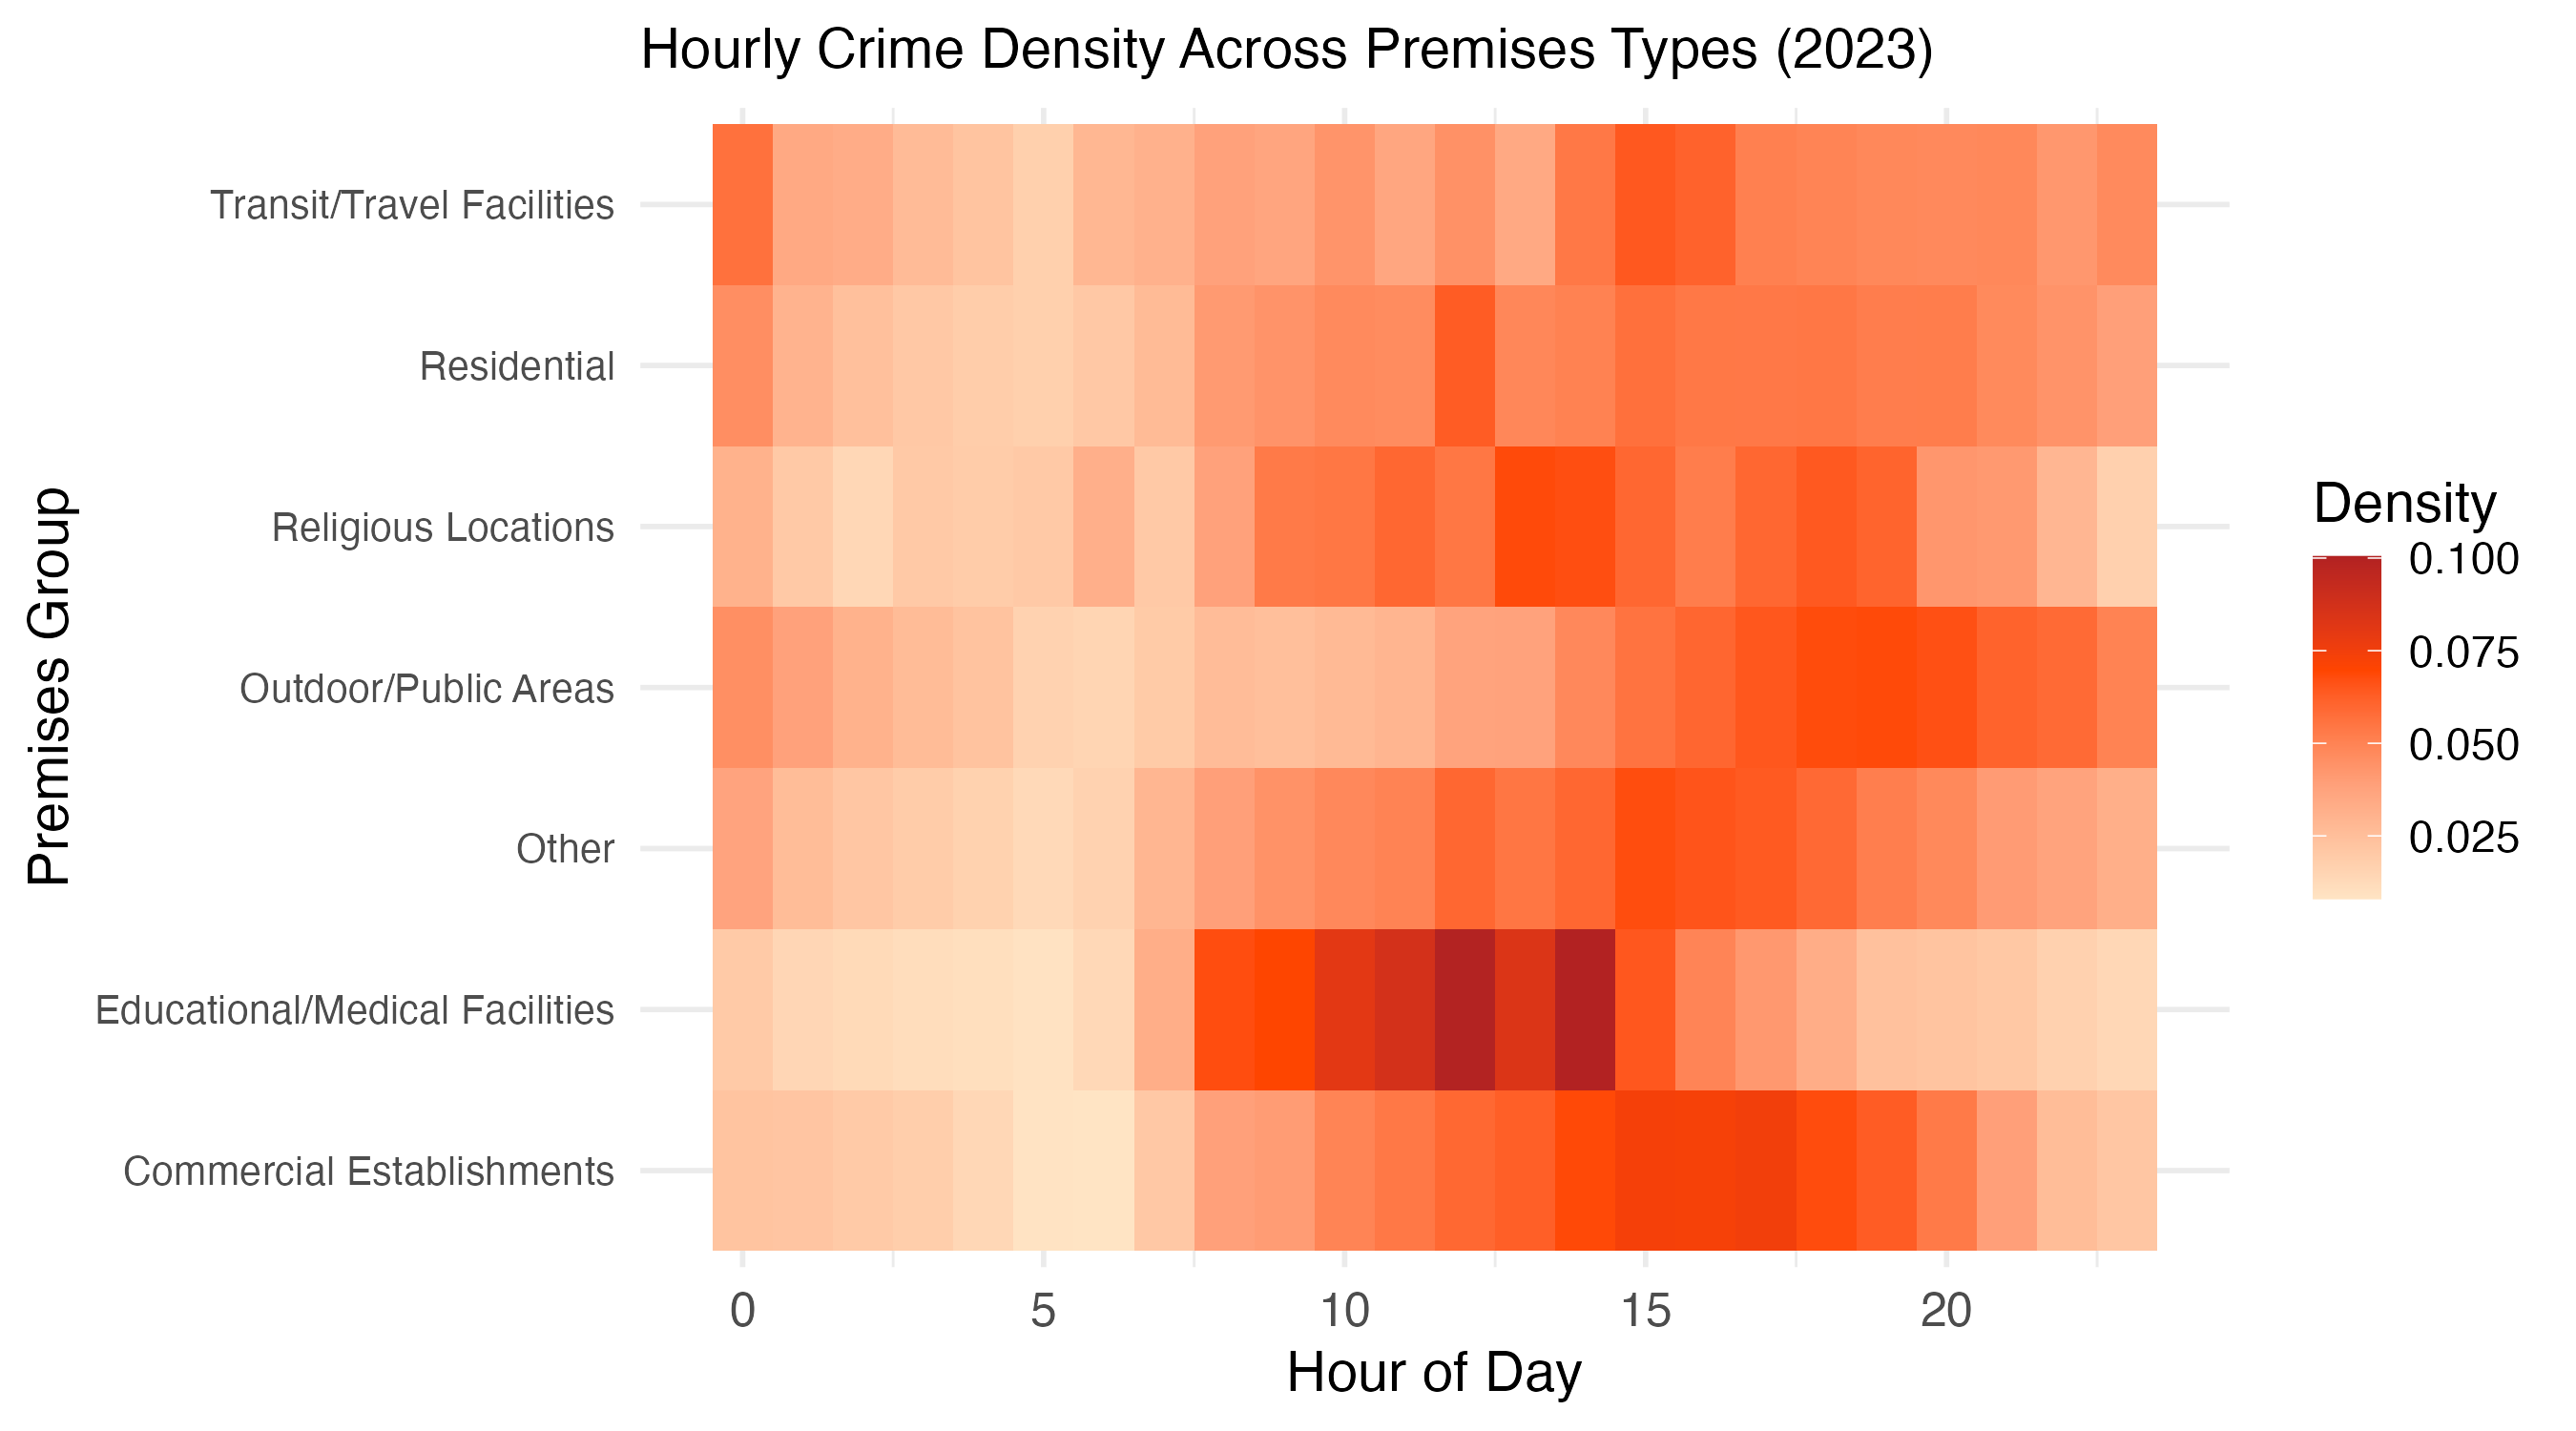
As shown in the heatmap in Figure 6, commercial establishments, such as stores and businesses, exhibit a pronounced peak in crime density during the afternoon and early evening hours (12 PM to 8 PM), aligning with their busiest operating hours. Similarly, transit and travel facilities and residential areas experience higher crime densities during morning and evening commuting hours. Educational and medical facilities exhibit the highest density of crime during the hours of 8 AM to 3 PM, likely corresponding to school and hospital operating hours. These premises stand out with the most intense color on the heatmap, indicating the highest crime density among all groups during these hours.
Similarly, religious locations show higher crime densities during daylight hours, from 8 AM to 7 PM, reflecting periodic gatherings or events typically held during these times. In contrast, outdoor and public areas display a distinct pattern, with crime density increasing notably as the sun goes down, peaking between 4 PM and 11 PM. This trend may be attributed to increased social and recreational activities in public spaces during the evening hours. On the other hand, all premises types show consistently low crime density during the early morning hours, from 12 AM to 6 AM, reflecting a general decline in activity during these times.
Crime Offense Types Through the Day: Variations by Morning, Afternoon, Evening, and Night
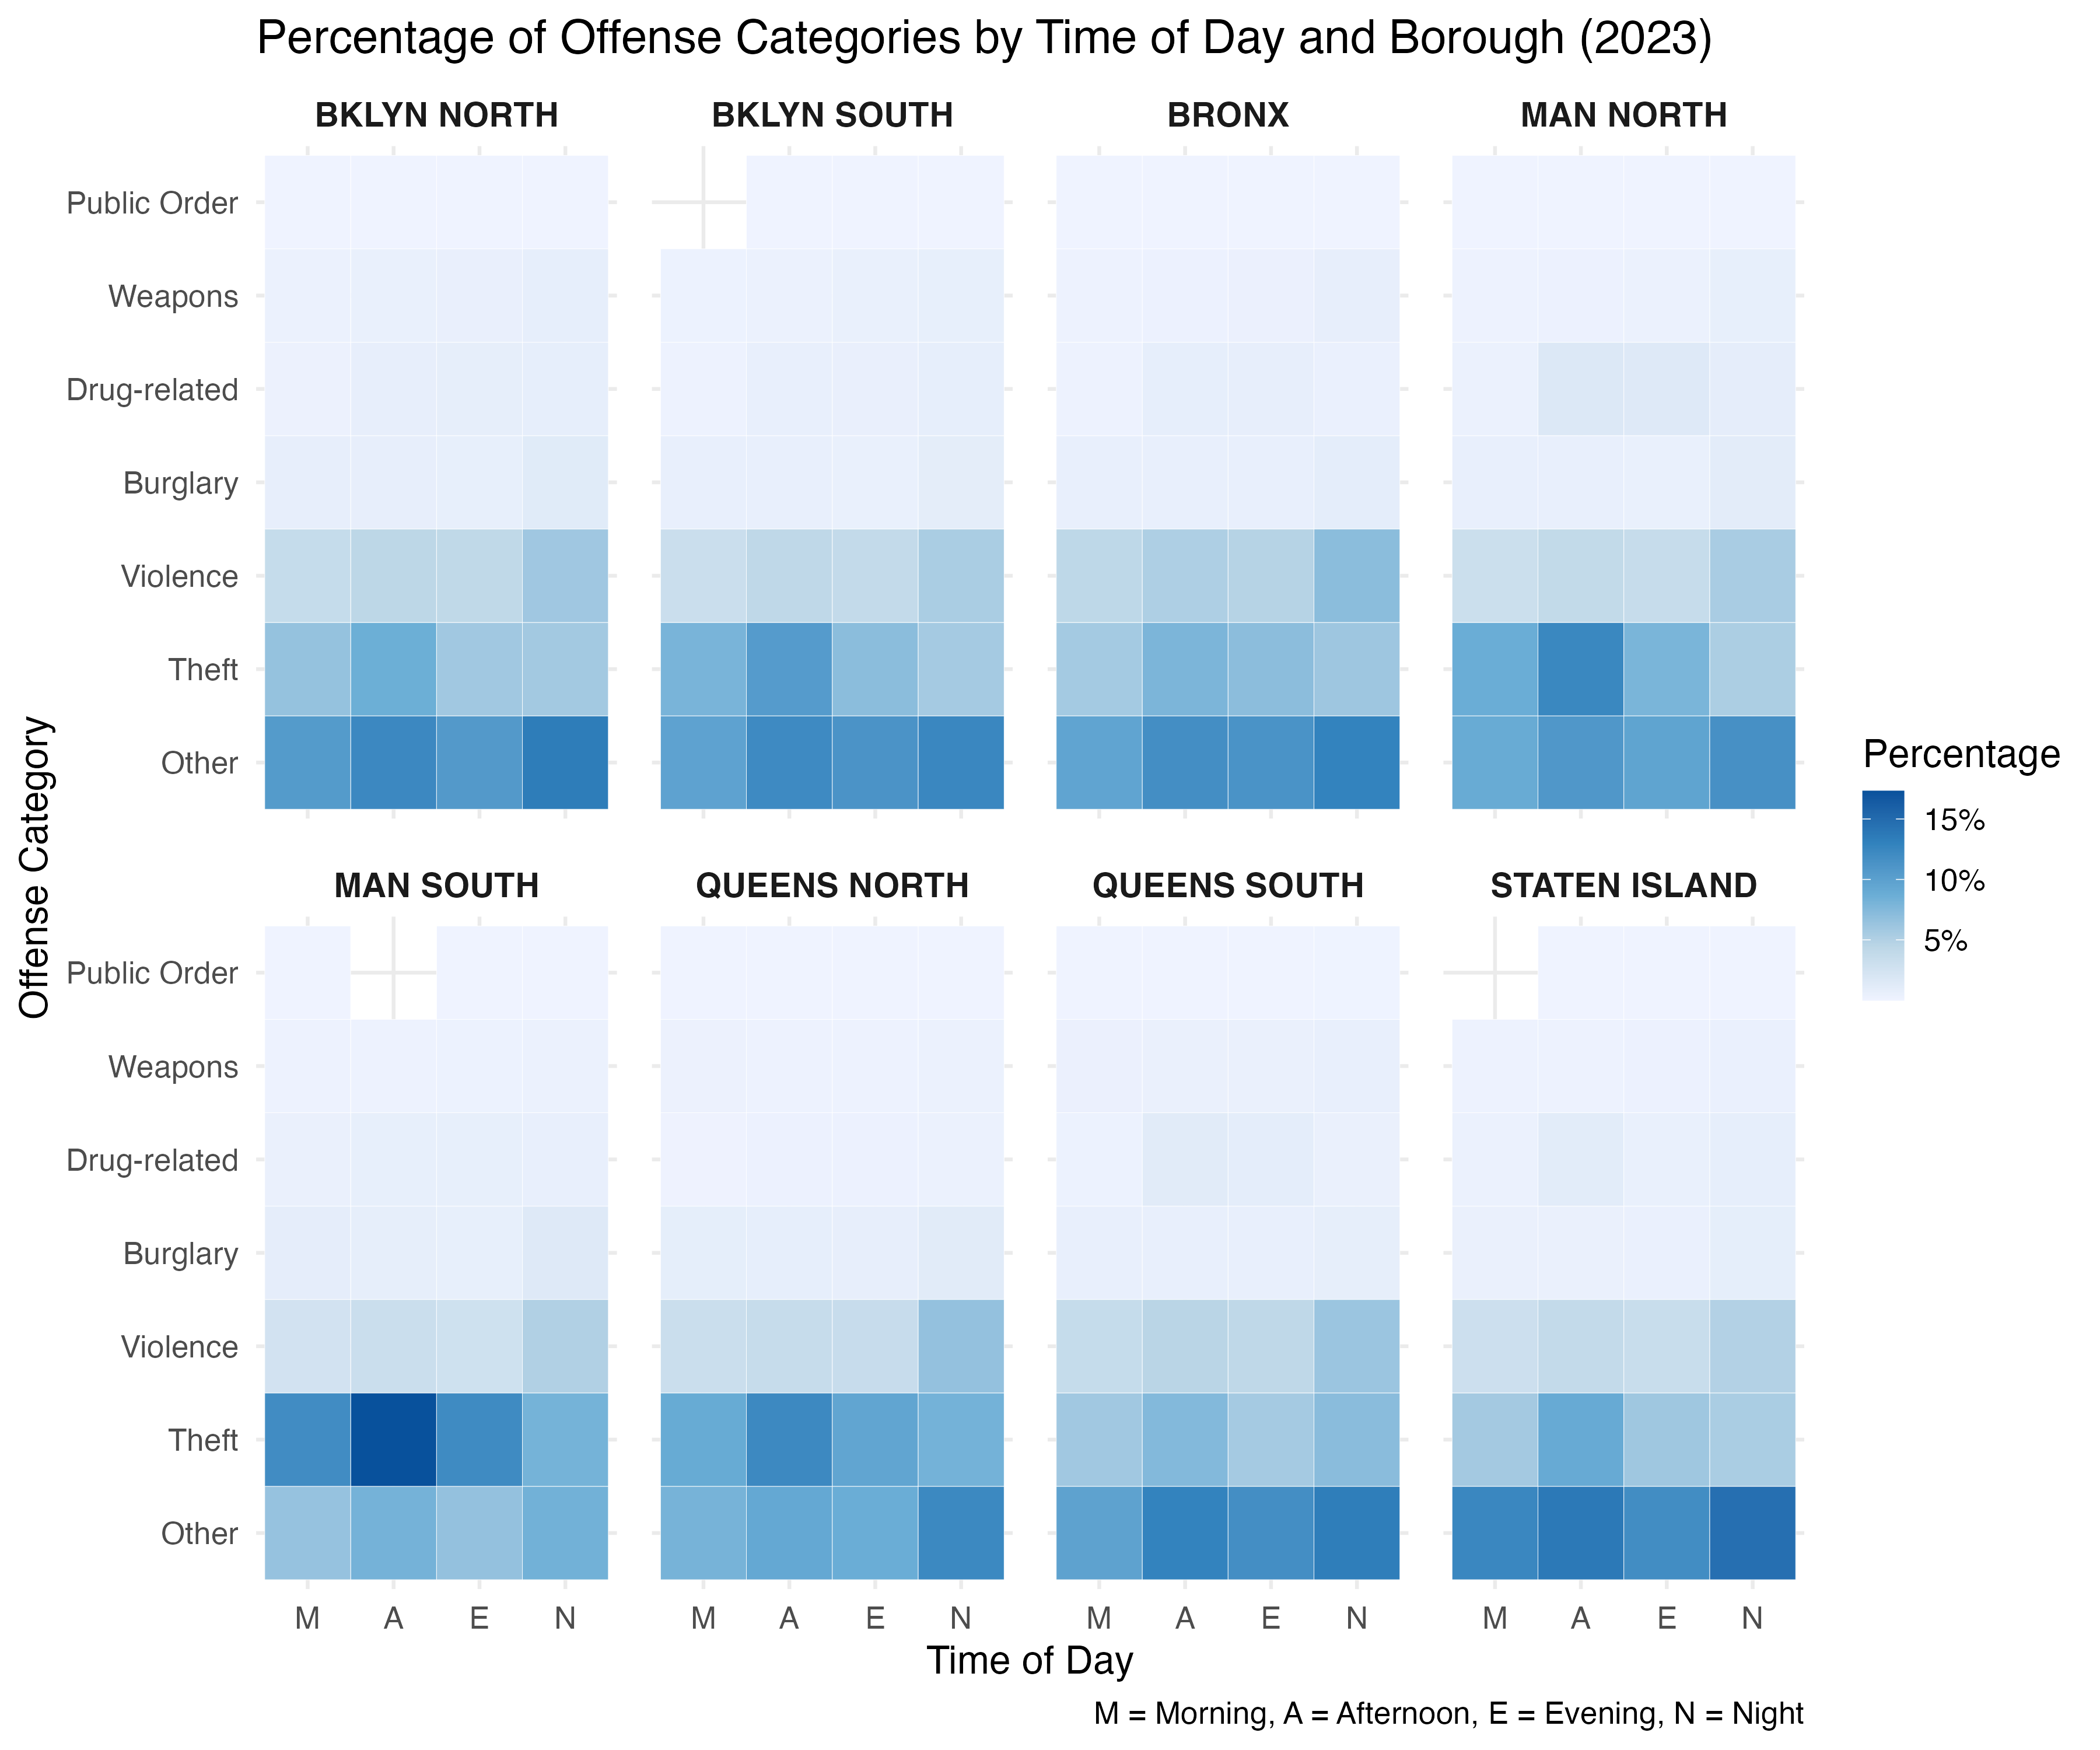
After identifying the most frequent premises locations, we now explore some of the most prominent crime categories. Figure 7 demonstrates a heatmap of different crime categories distributed across various times of the day in each borough. Each heatmap sums to 100%, indicating the relative frequency of each crime category for that borough and time period. Given this information, our team observed that Theft was one of the most frequent categories, followed by Violence. Theft most frequently happens in the afternoon (12 PM to 5 PM), whereas Violence most frequently occurs at night (9 PM to 5 AM) across all patrolling boroughs. Burglaries also tend to occur more often at night, but the difference in frequency is relatively small compared to the differences observed for Theft and Violence. For drug-related offenses, boroughs like MANHATTAN-NORTH, QUEENS SOUTH, and STATEN ISLAND showed slightly higher frequencies during the afternoon and evening (5 PM to 9 PM), but the differences were also less pronounced compared to other categories. These findings suggest that more patrolling during afternoon hours might help address Theft, while increased enforcement at night could reduce Violence and Burglaries in all boroughs of NYC.
Crime and Gender: Analyzing Suspect Demographics Across Boroughs
Understanding crime patterns also involves exploring the demographics of suspects. By analyzing the distribution of suspect sex across boroughs, we gain deeper insights into how criminal activities differ among different groups. We examine how reported incidents vary by borough and suspect sex in 2023 (Figure 8). It is important to note that suspect sex refers to individuals identified as suspects in criminal activities. This bar chart highlights the proportions of male, female, and other suspect sex categories in each borough.
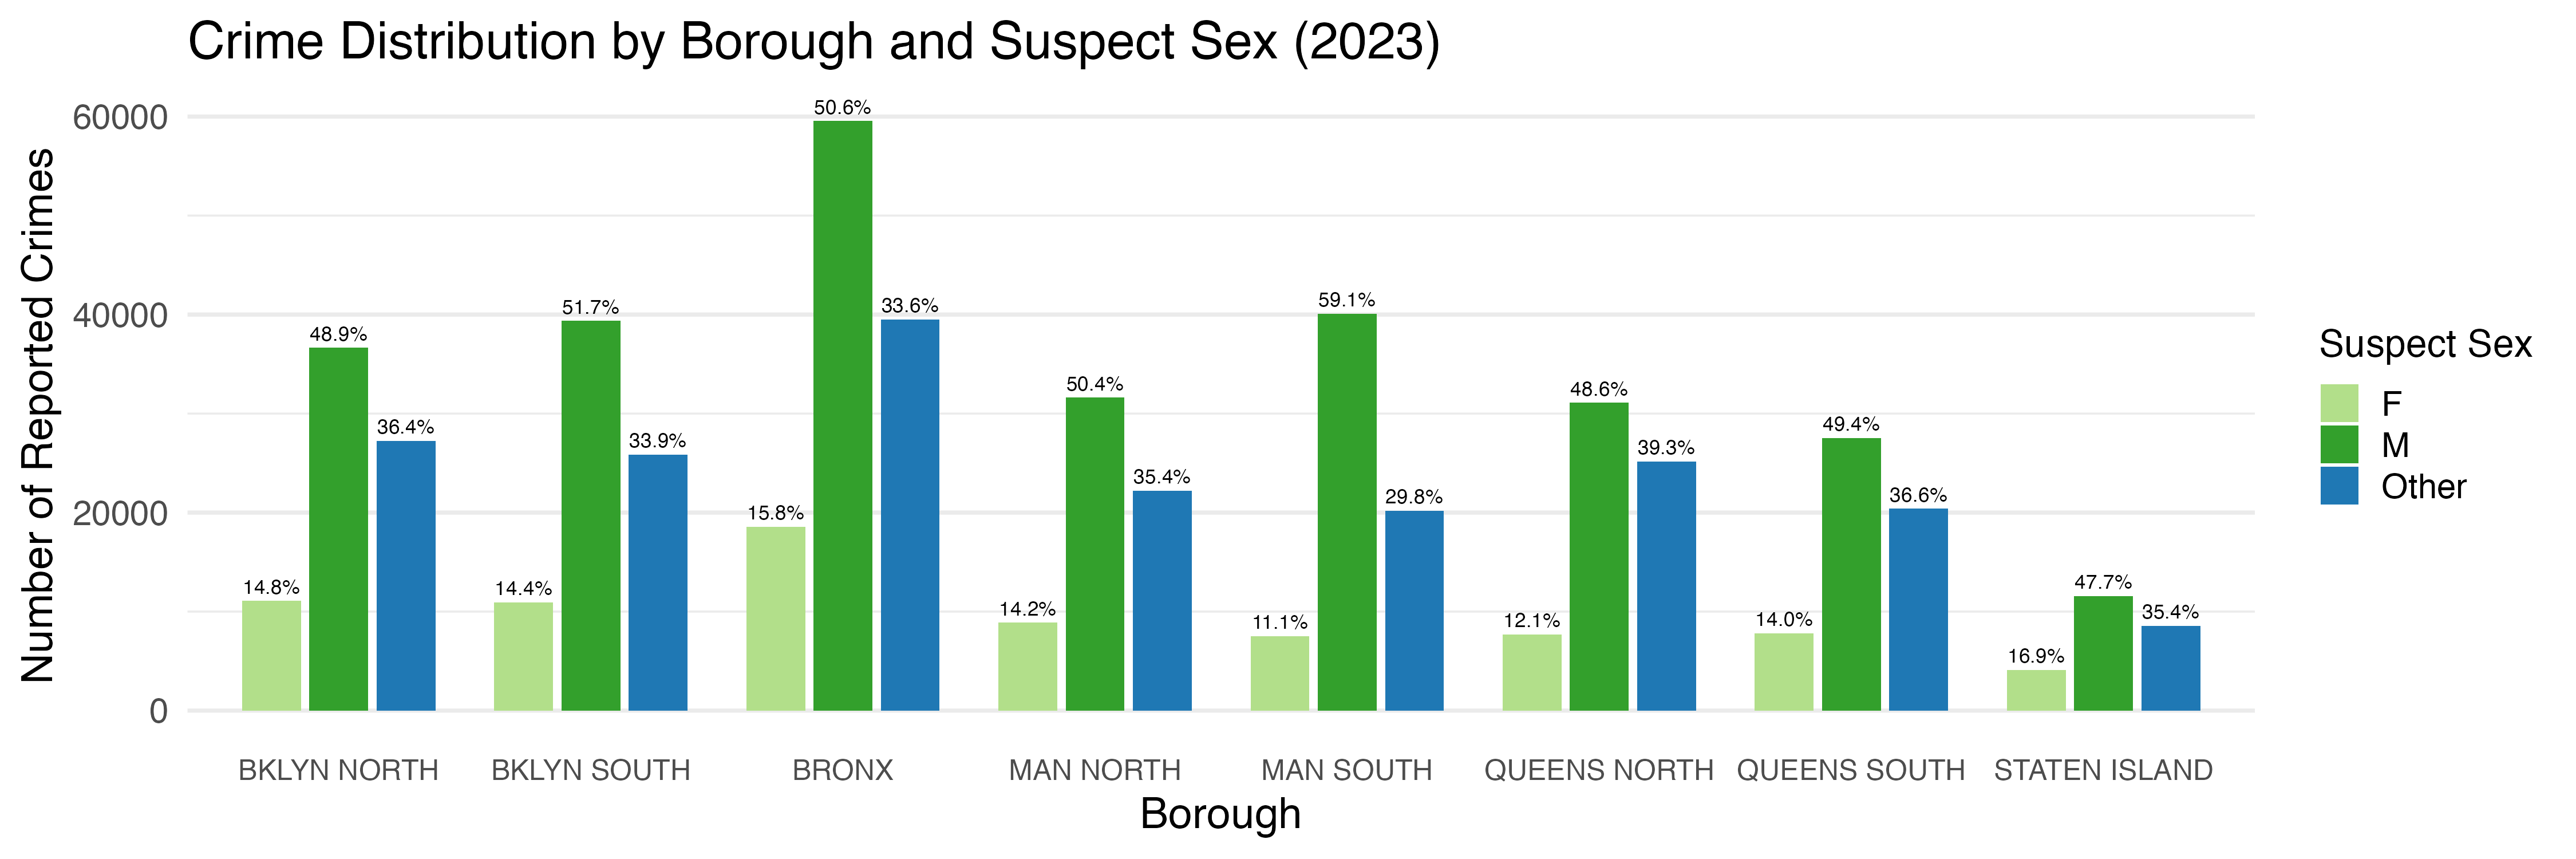
Across all boroughs, male suspects consistently account for the majority of reported crimes. For example, in the Bronx, 50.6% of crimes were attributed to male suspects, the highest percentage among all boroughs. Similarly, Queens North (59.1%) and Brooklyn North (51.7%) show high male representation. Female suspects represent a smaller but significant portion of reported crimes, ranging from 11.1% in Manhattan South to 16.9% in Staten Island. Notably, Staten Island has the highest proportion of female suspects compared to other boroughs.
The category labeled “Other” includes suspects whose sex is unidentified or falls outside traditional categories. This group shows considerable variation across boroughs, with Manhattan North and Brooklyn North recording relatively higher percentages of 35.4% and 36.4%, respectively.
Age Dynamics in Crime: Suspect and Victim Interactions
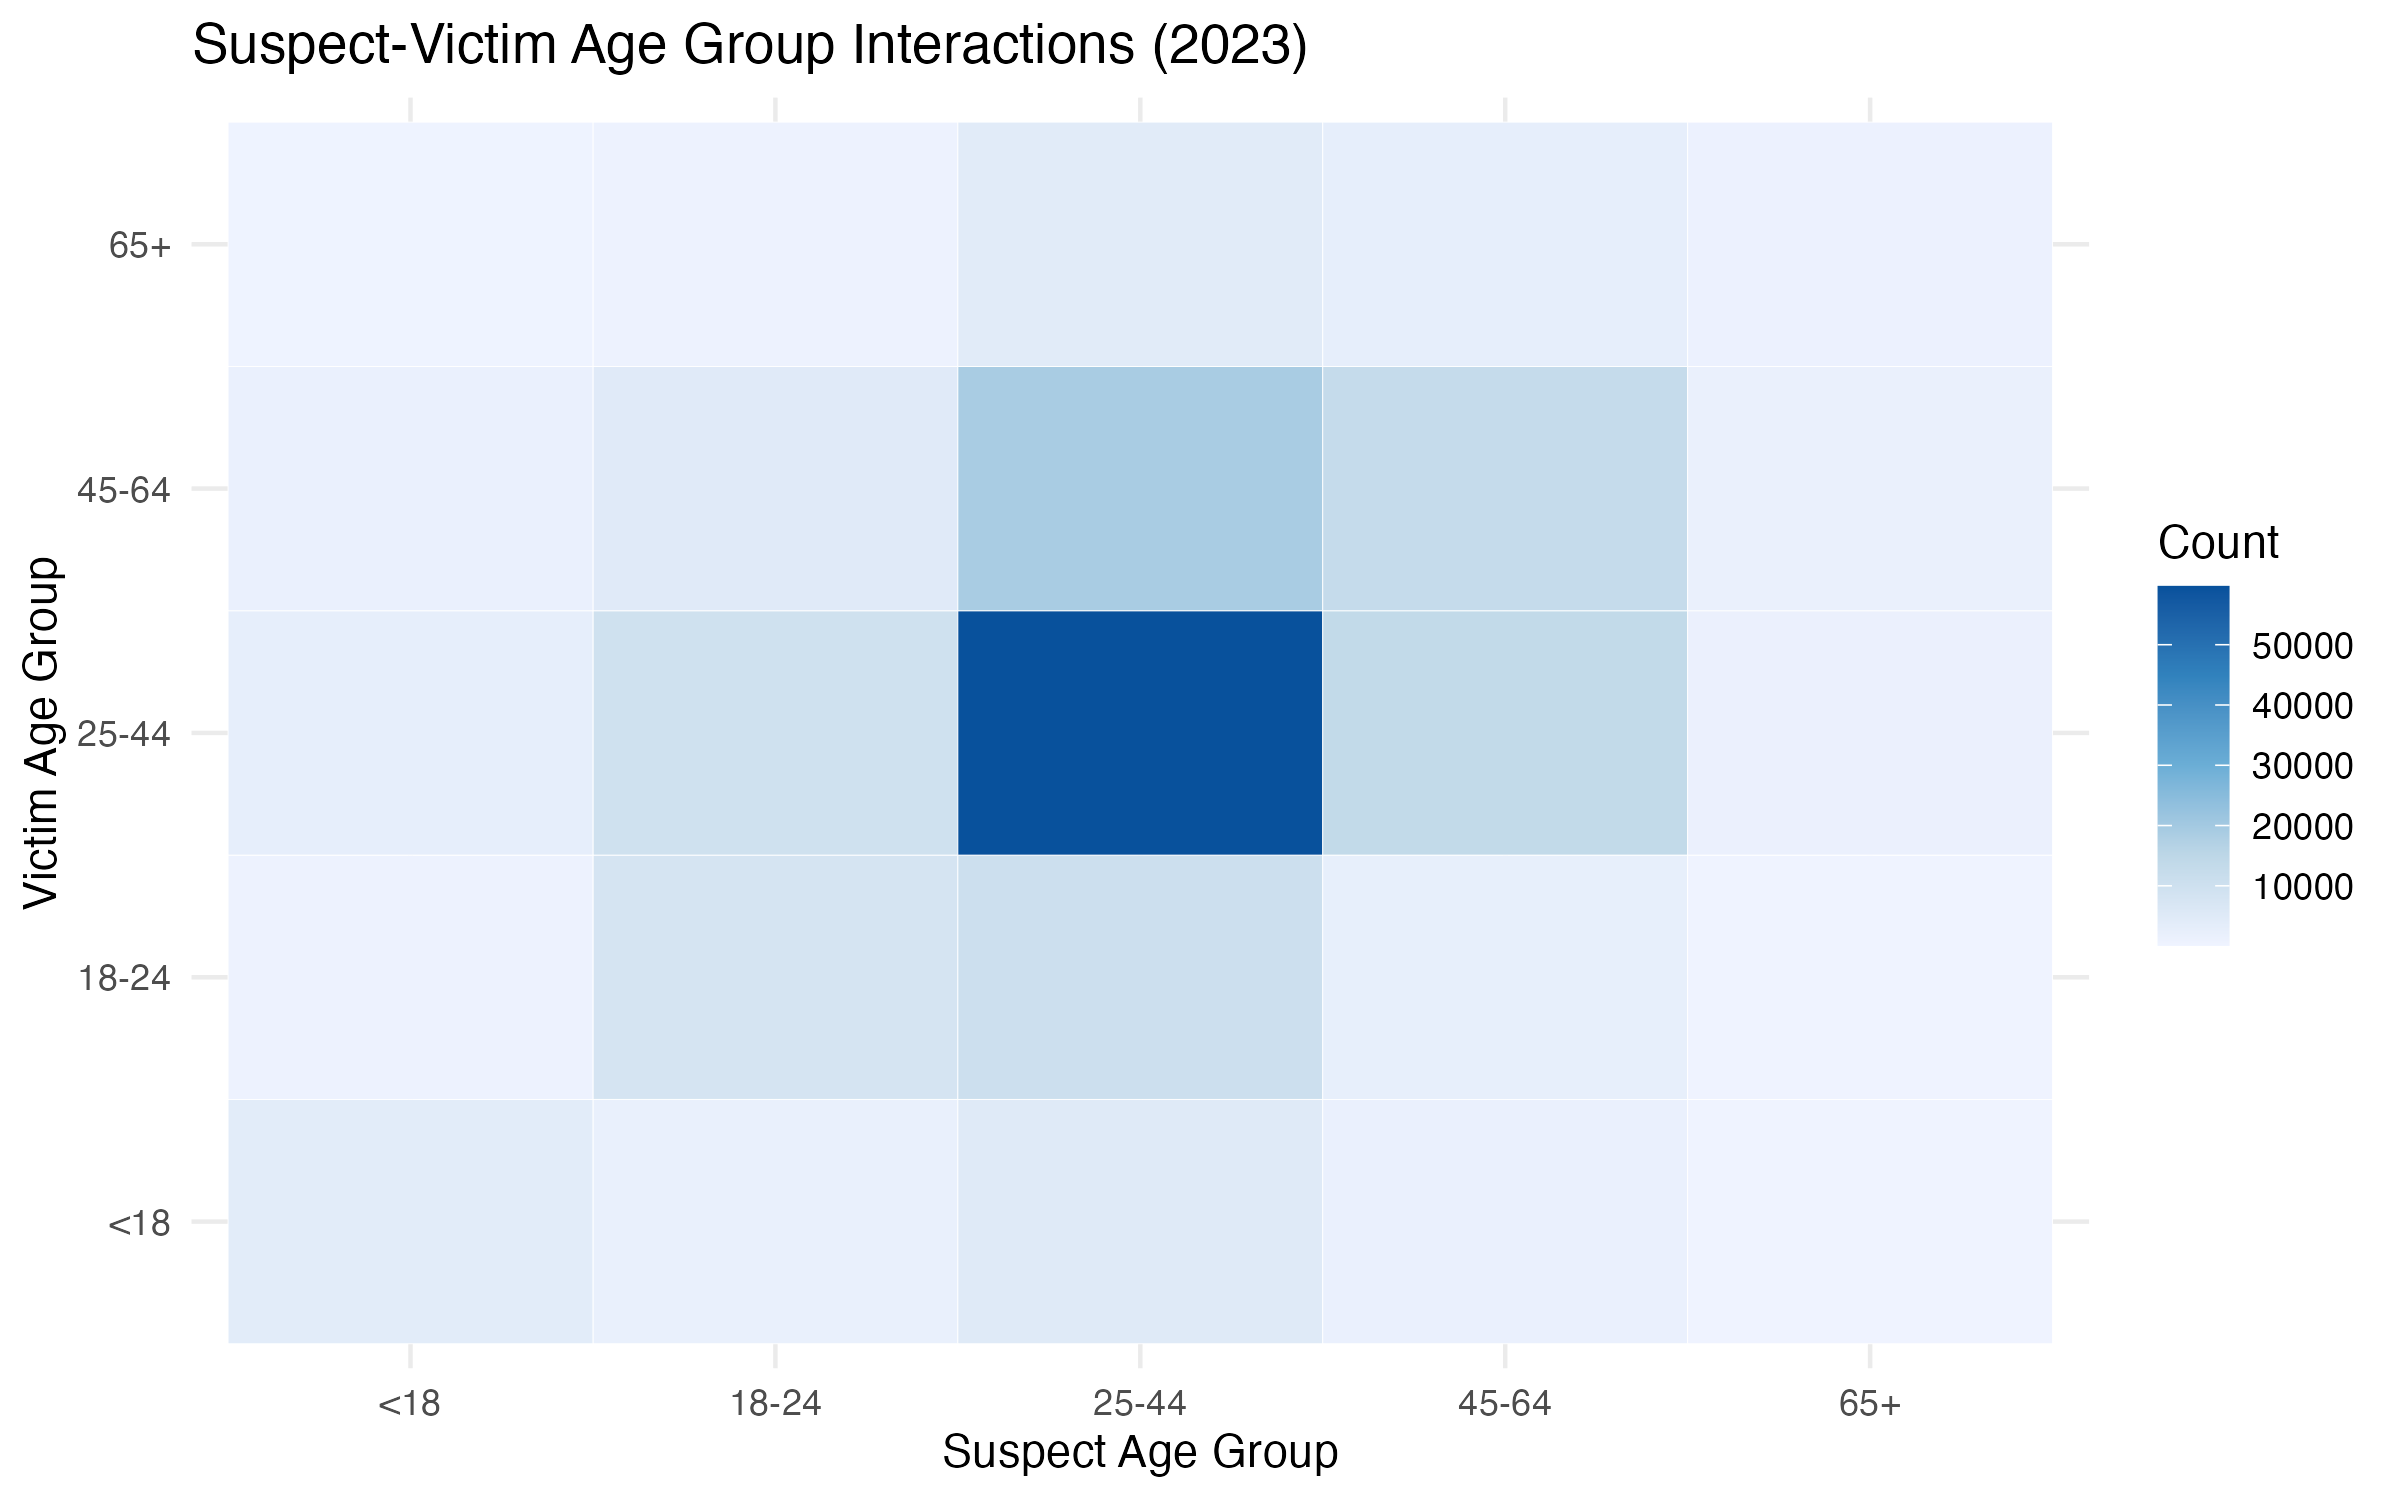
Looking at age groups interactions, it was found that the most frequent suspect-to-victim interactions occur within the 25-44 age group. Additionally, the distribution of victim age groups is broader compared to suspects, as indicated by the wider spread of colors for victims across all age categories (Figure 9). This suggests that more resources should be allocated to neighborhoods with a higher concentration of middle-aged adults.
Crime Severity Across Boroughs: Patterns of Violations, Misdemeanors, and Felonies
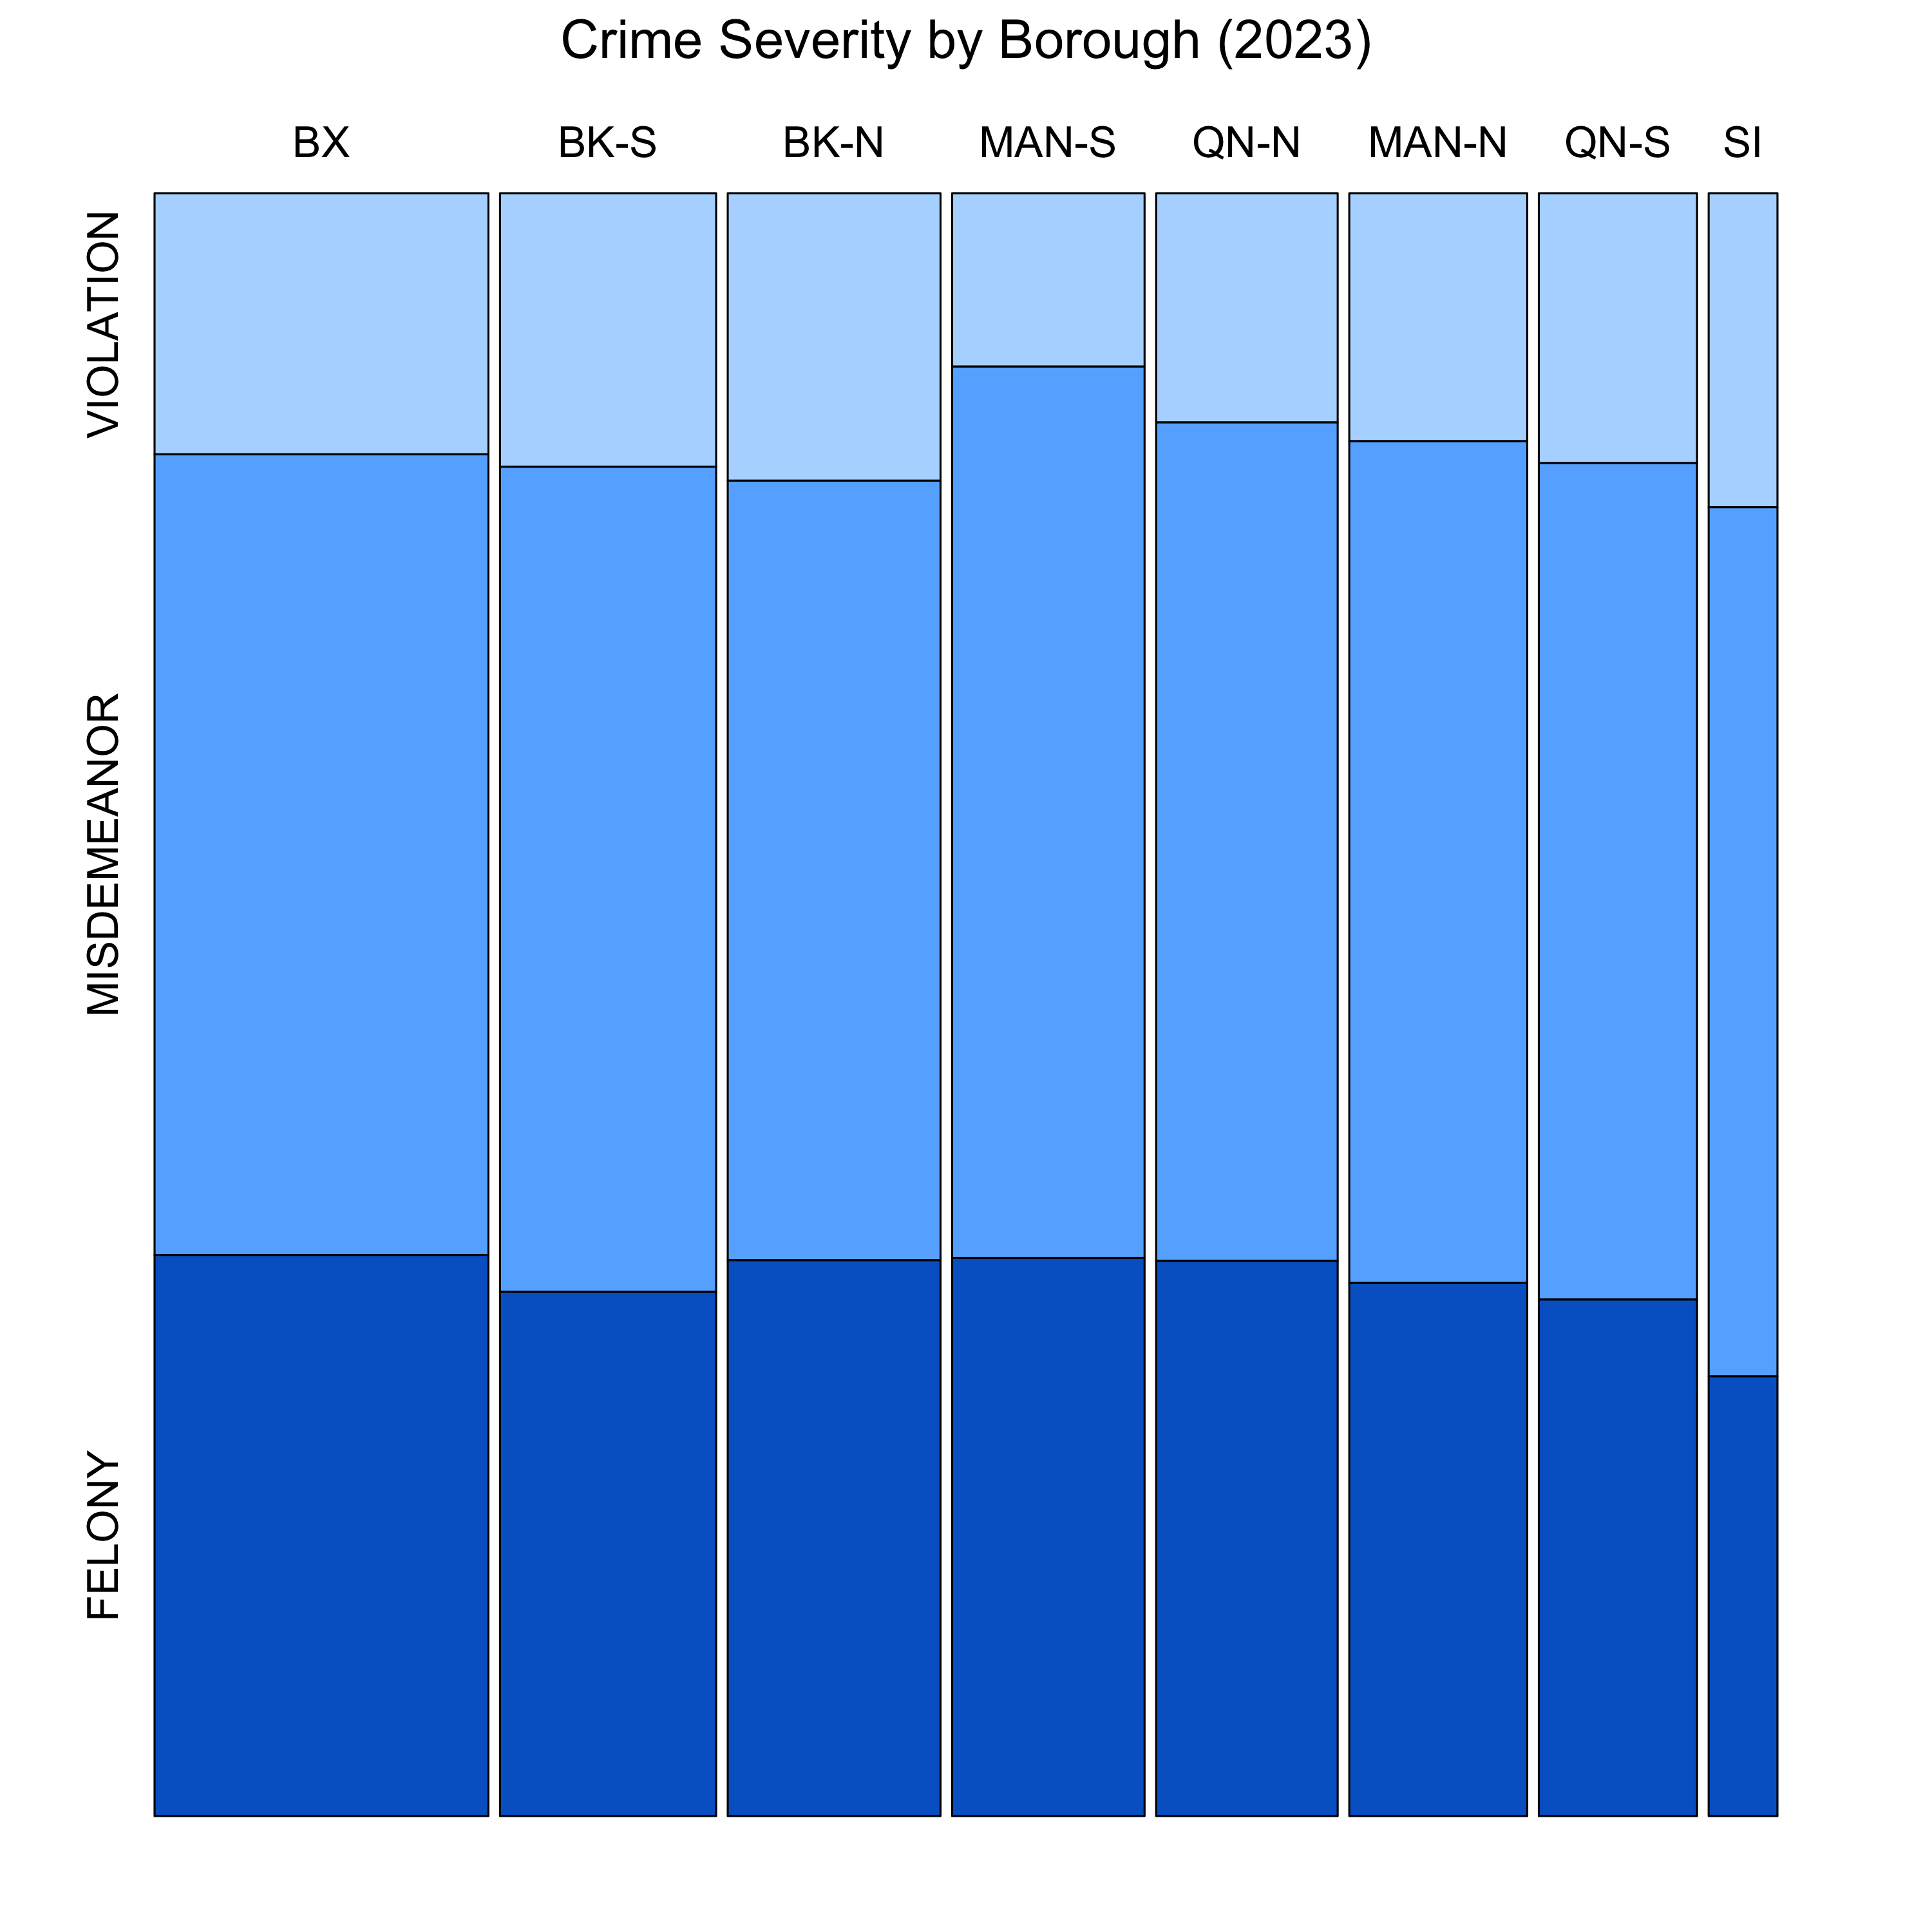
Now we examine whether there’s a correlation between offense severity and borough, with severity levels classified as follows, from least to most severe: VIOLATION, MISDEMEANOR, and FELONY. The boroughs remain the same as before, which are different patrol areas (boroughs) as recorded in the dataset. It was observed that the distribution of each severity level is fairly consistent across the patrol boroughs (Figure 10). Only STATEN ISLAND had a relatively lower proportion of FELONY cases. However, this could be attributed to STATEN ISLAND’s lower population, leading to fewer crimes and observations overall. MANHATTAN-SOUTH had a slightly higher relative proportion of MISDEMEANOR cases, but the difference was still not significant. These findings suggest that there’s a very weak to no correlation between the severity of crimes and the borough in which they occur. Additionally, it was noted that the BRONX had a higher number of complaints filed compared to other boroughs.
Geographic Crime Distribution: Hotspots Across New York City
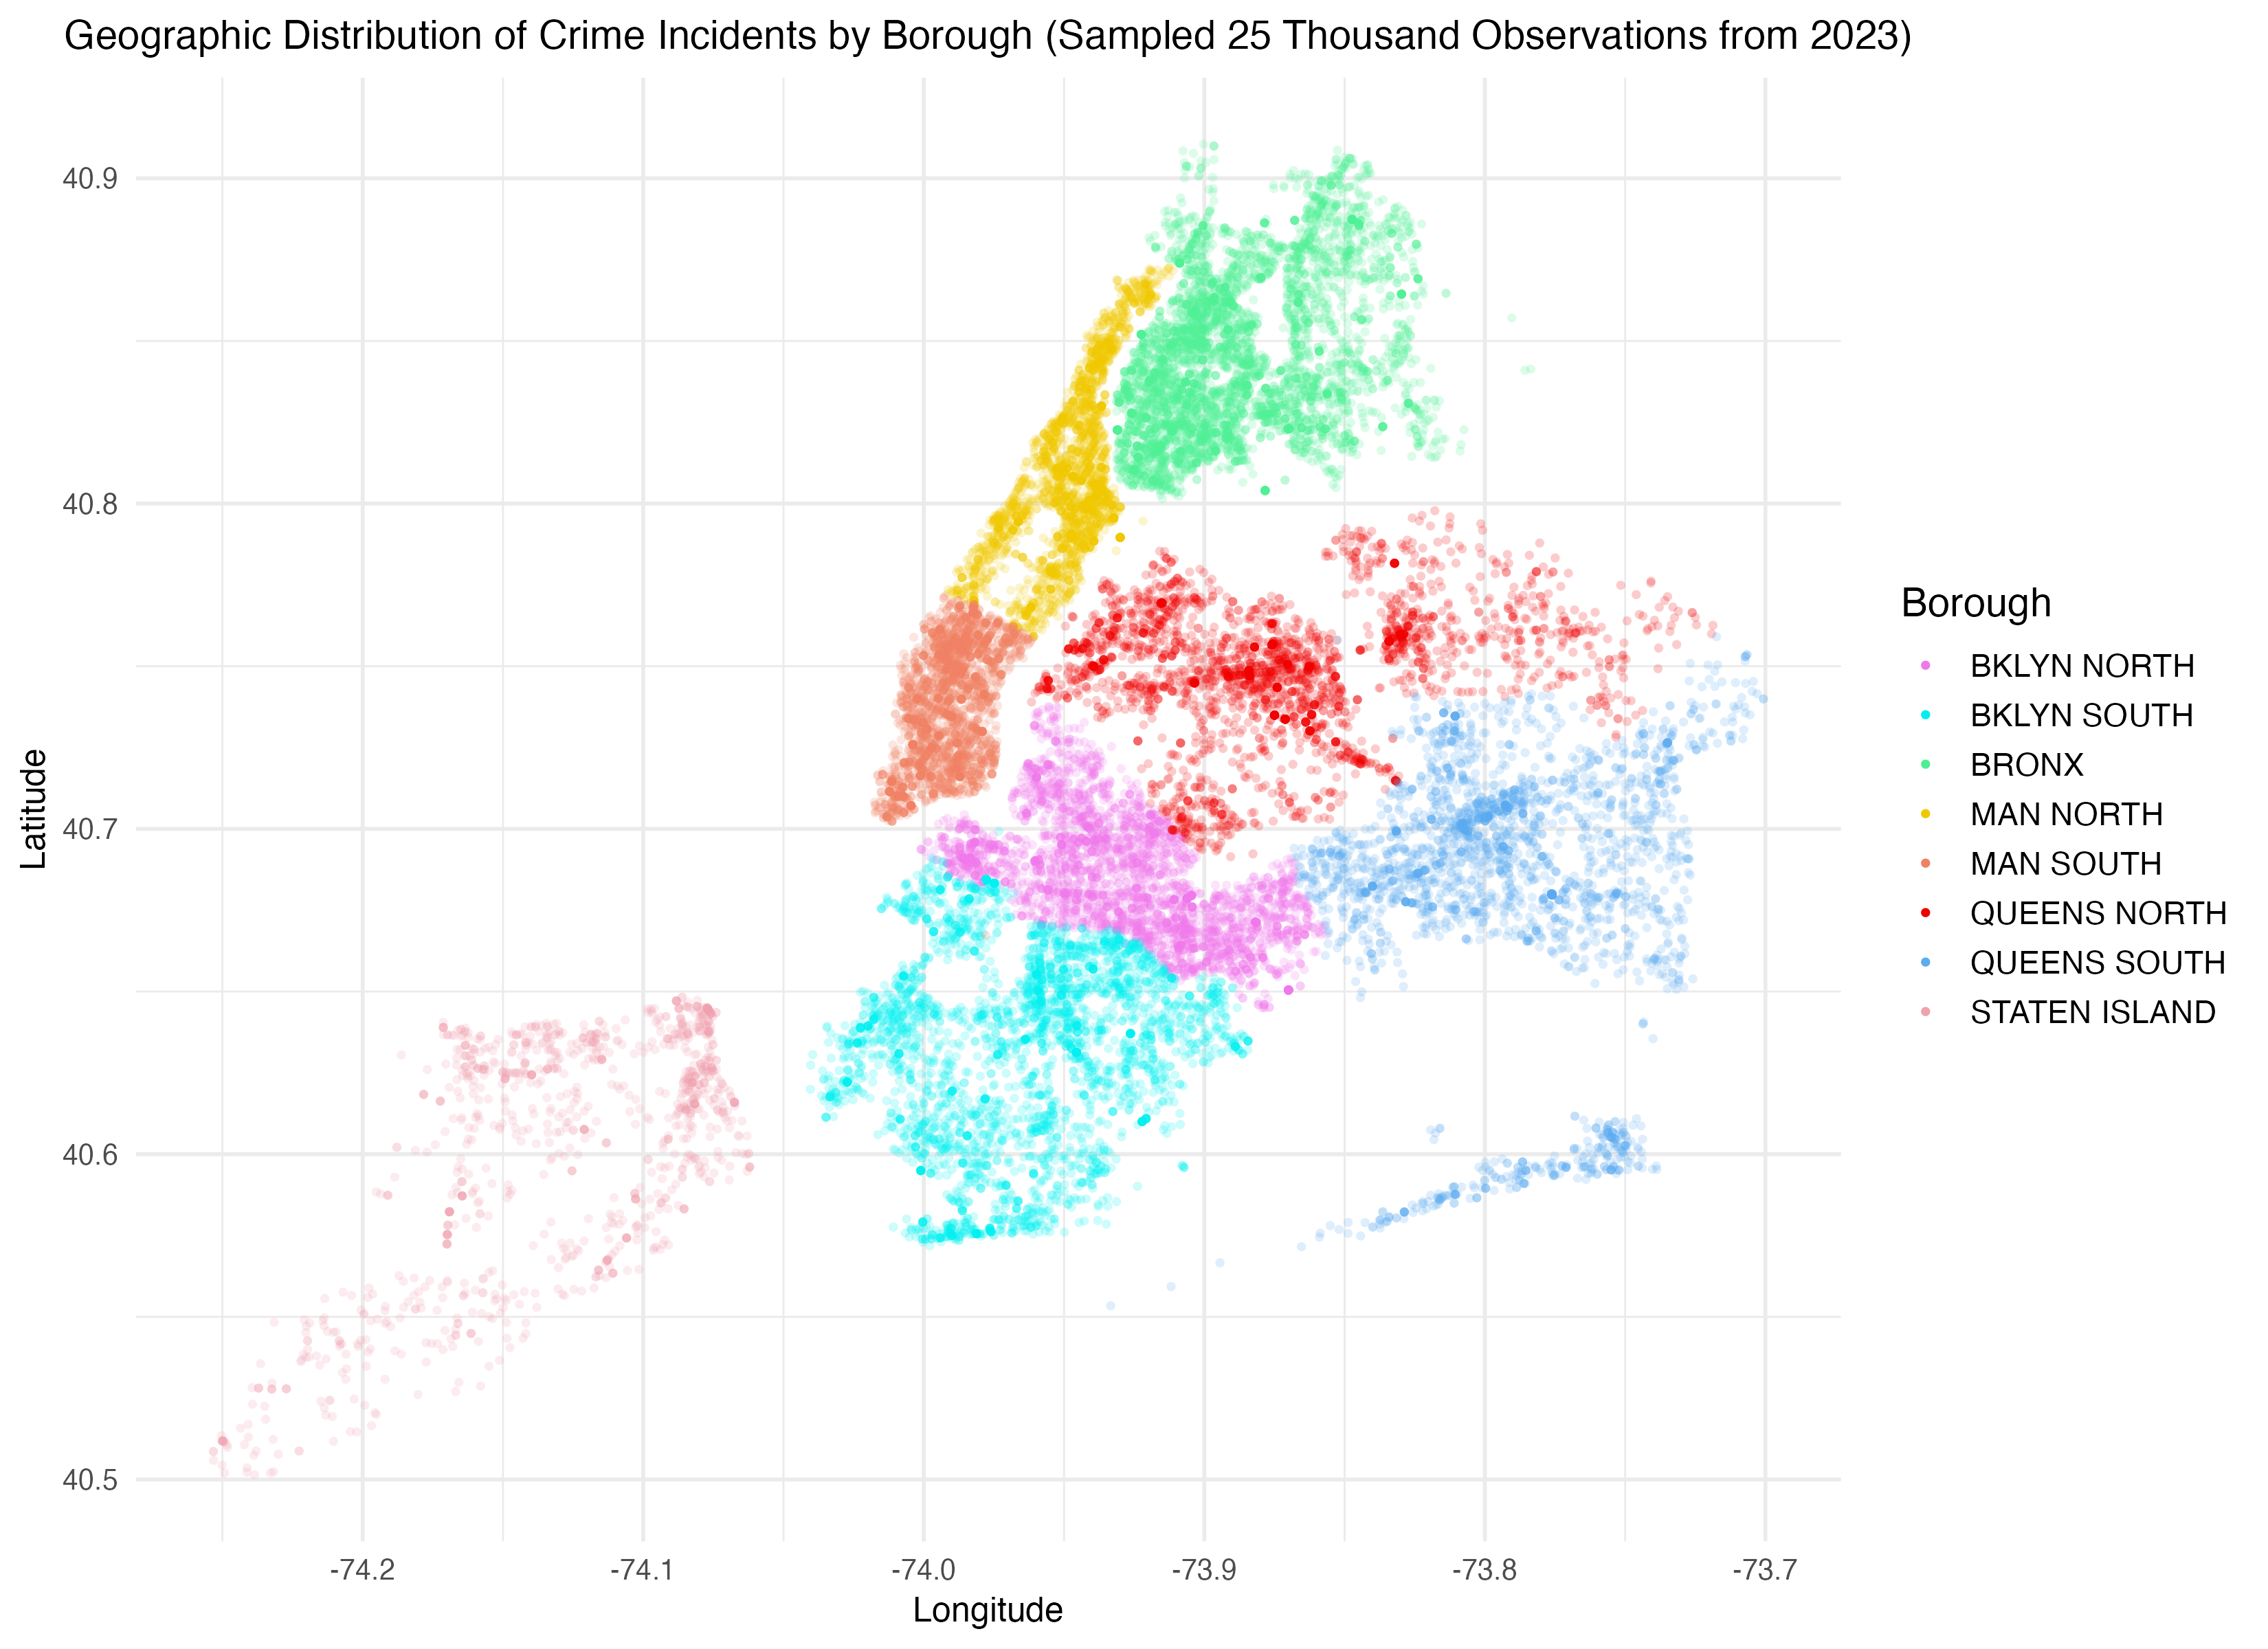
Building on the previous analyses of time, suspect demographics, categories, and premises, Figure 11 provides a spatial perspective on crime distribution across New York City boroughs. It illustrates the sampled 25,000 observations across the entire city, with each patrolling borough’s sample size proportional to its representation in the overall dataset. Although the sizes of the patrolling areas differ, we can still identify that STATEN ISLAND has a relatively lower volume of reported crimes, whereas MANHATTAN SOUTH and the BRONX exhibit the highest densities. This pattern is further supported by the difference in count of crimes occurring in each patrolling area, as shown in Figure 4. The geographic distribution also highlights areas within each borough where crime density is higher. For instance, in QUEENS NORTH, the densest area appears to be located around longitude -73.88 and latitude 40.75, likely representing a specific neighborhood with more concentrated crime activity. Therefore, further investigation could be conducted to identify these neighborhoods and allocate resources accordingly in these more concentrated areas.
Note: Please refer to analysis2.qmd for detailed code implementation.